4.2.3 Pipeline imports to the Baltic States and Finland disruption
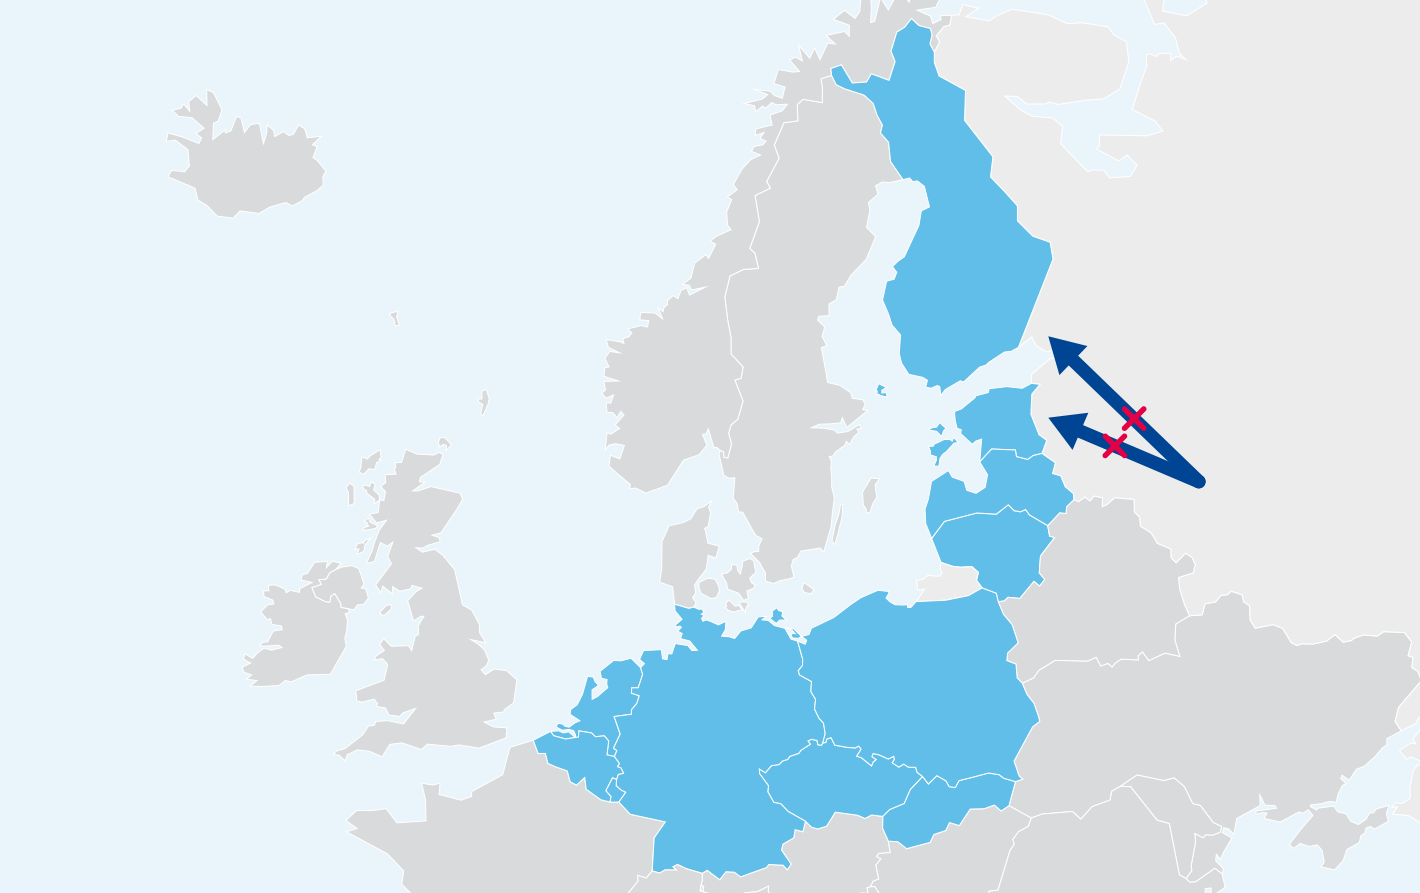
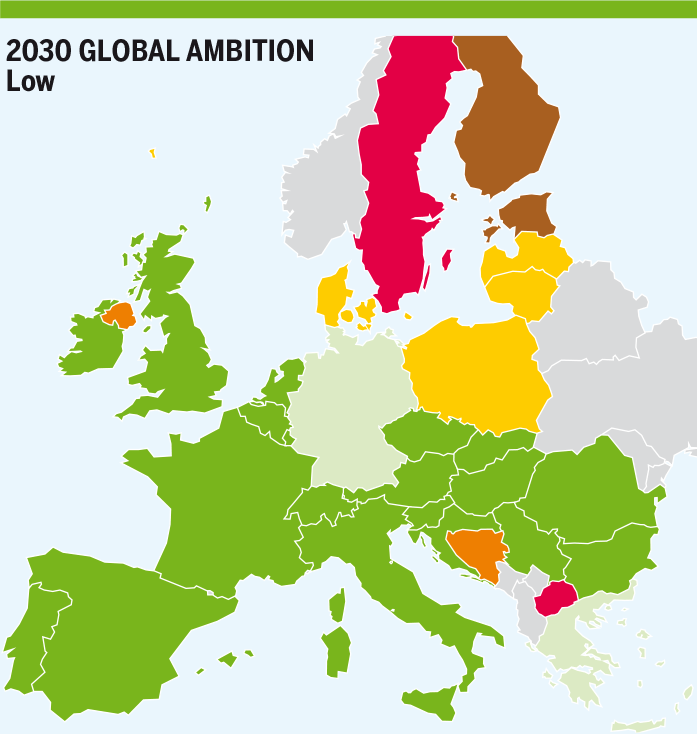
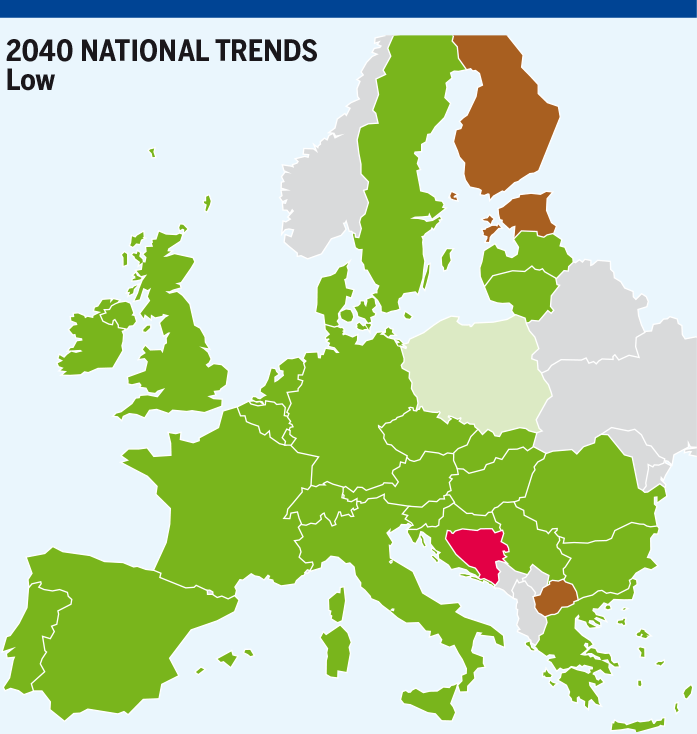
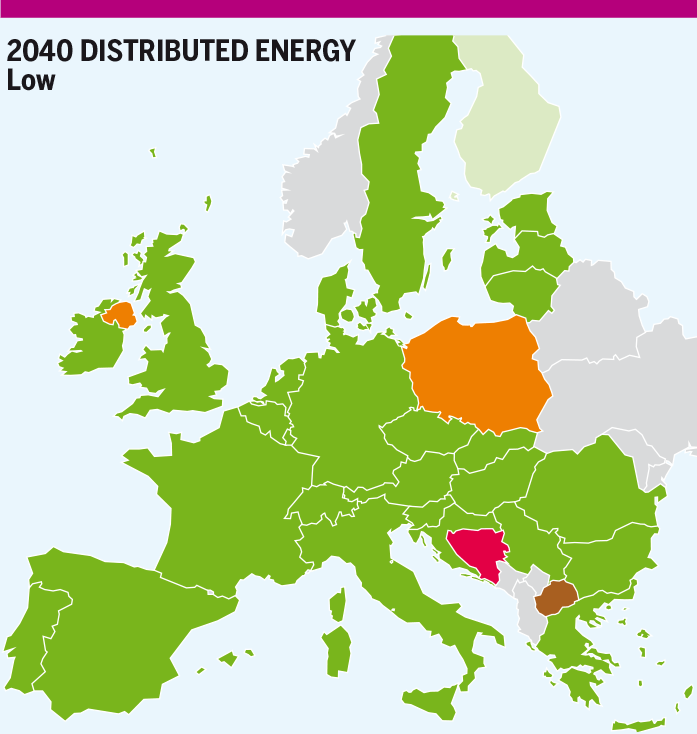
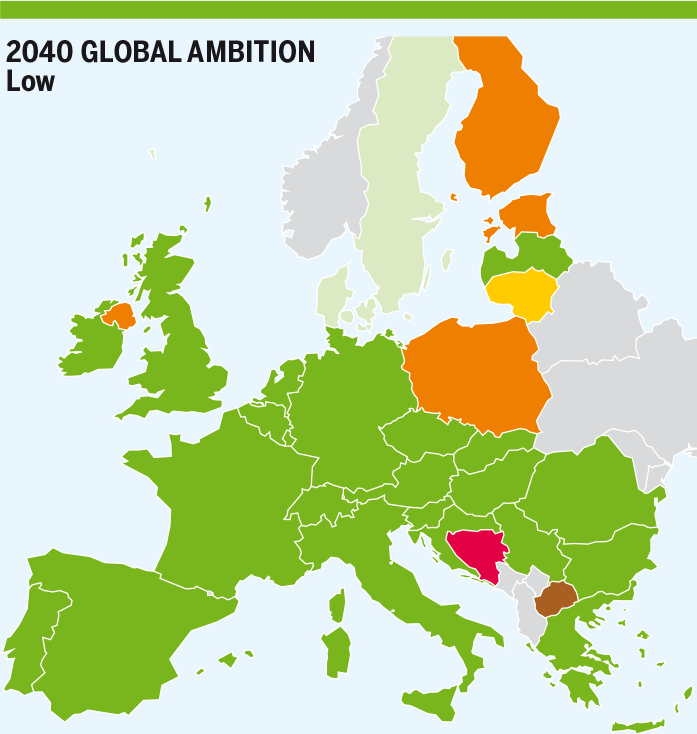
This assessment considers the disruption of all imports in Finland, Estonia and Latvia during climatic stress situations and the risk group is formed by Estonia, Finland, Latvia, Lithuania and Czech Republic, Belgium, Germany, Luxembourg, Netherlands, Poland and Slovakia.
4.2.3.1 Peak Day
Existing Infrastructure level
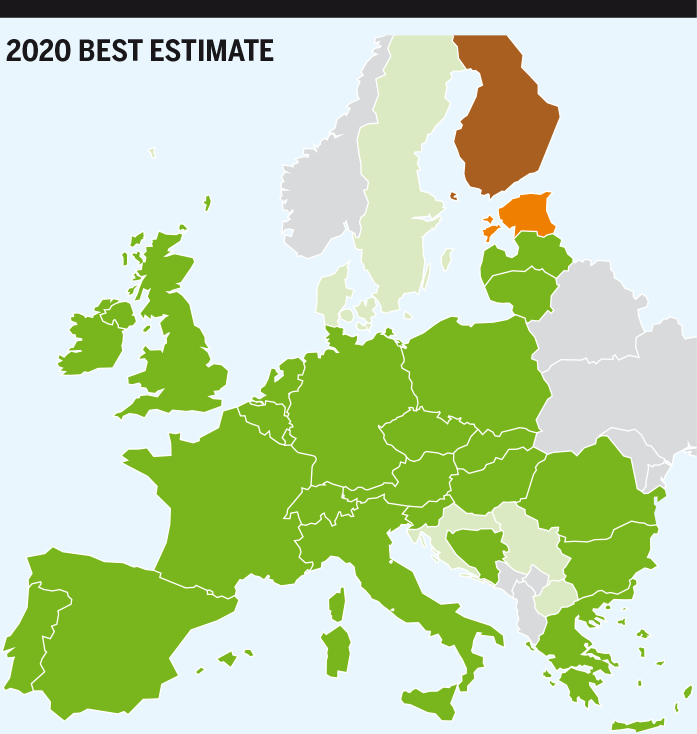
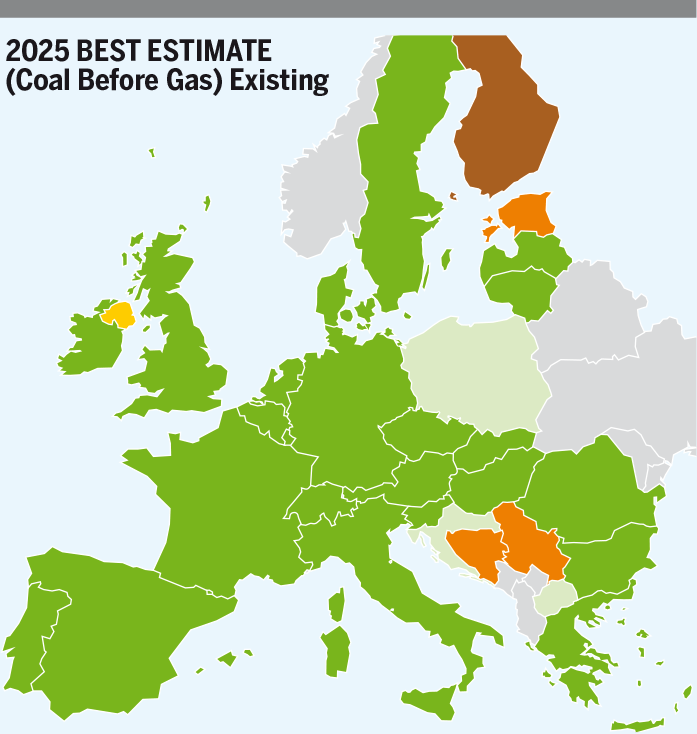
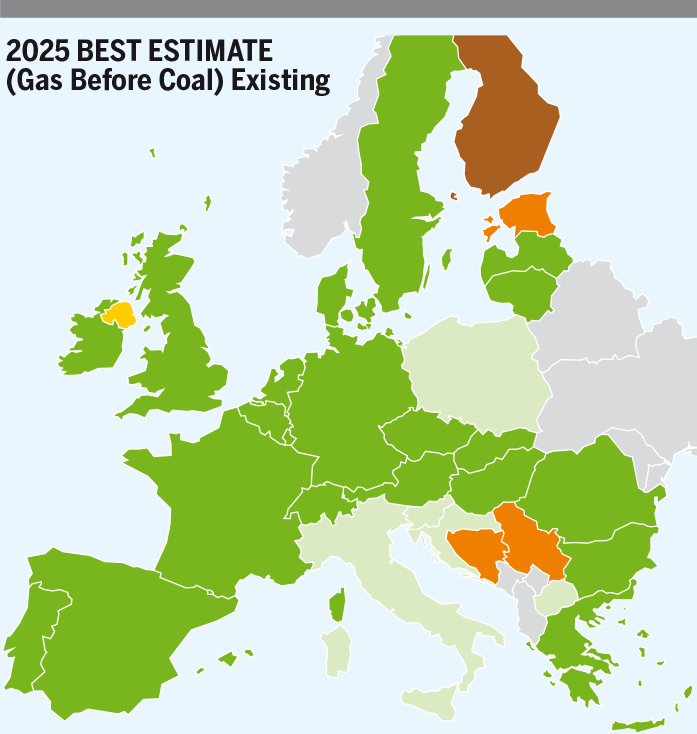
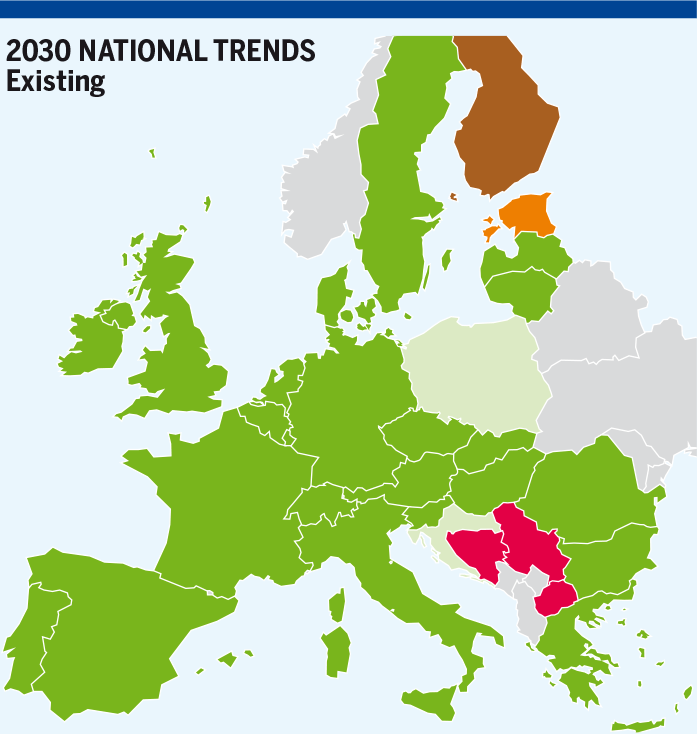
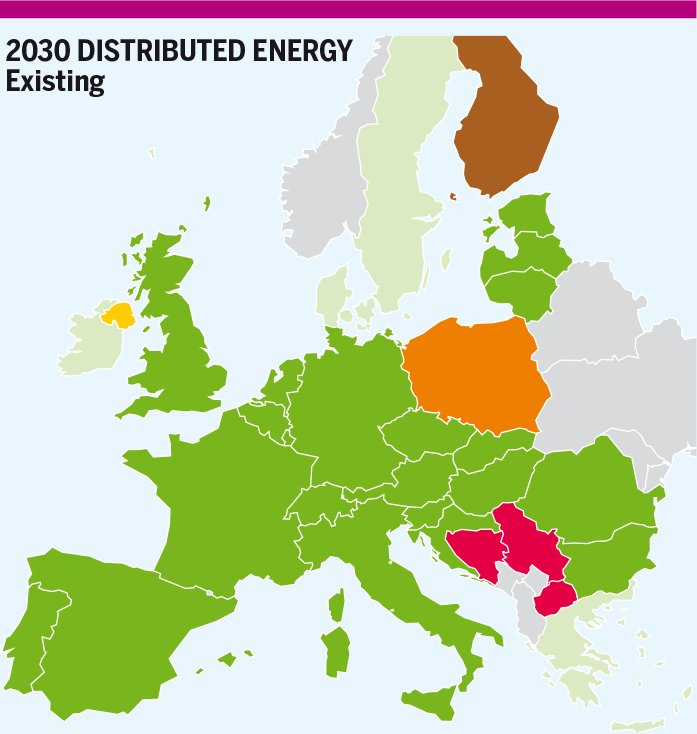
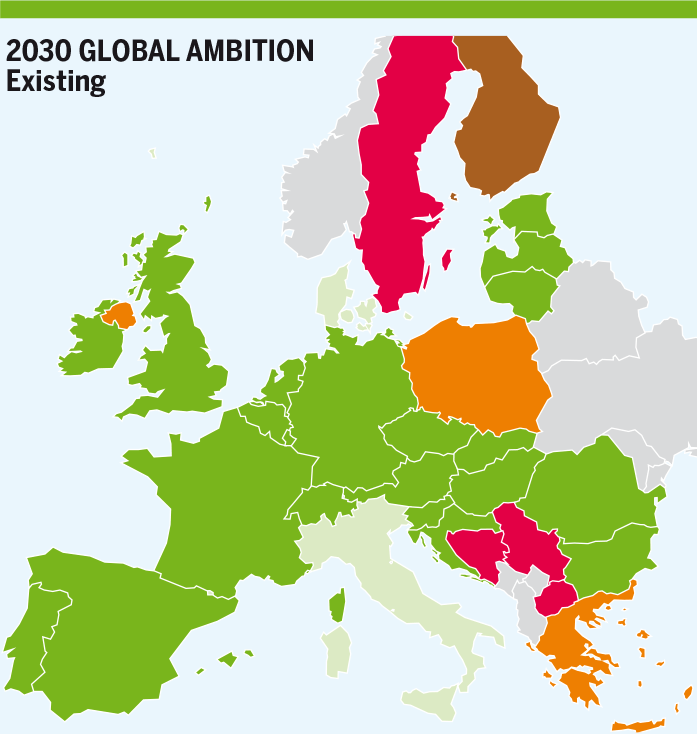
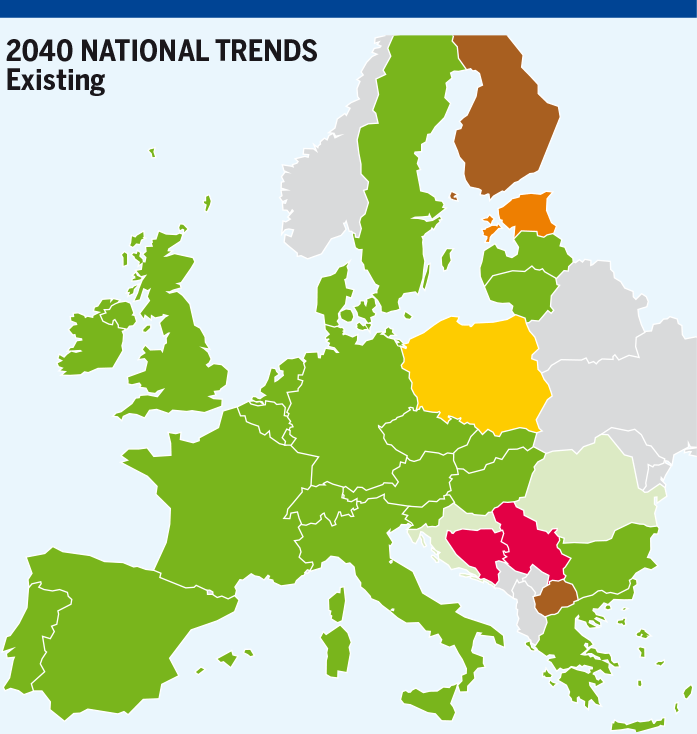
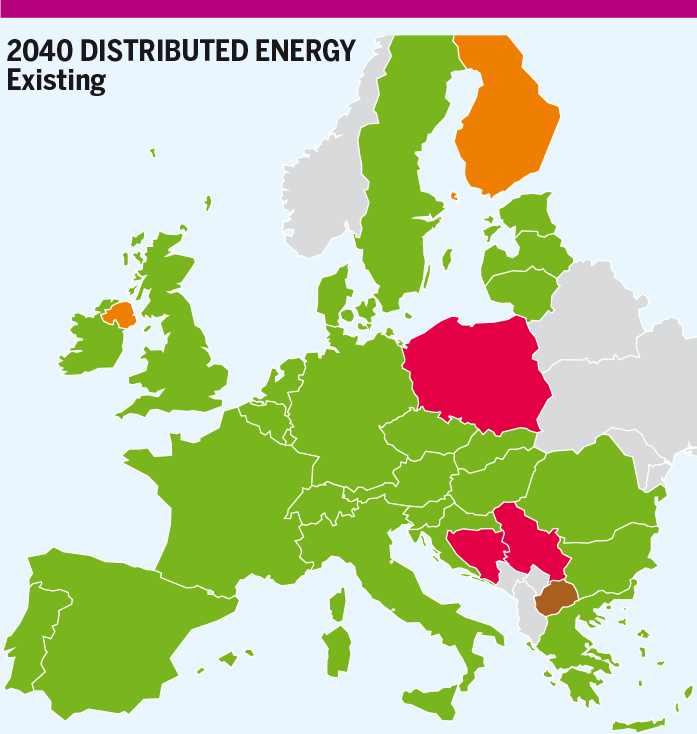
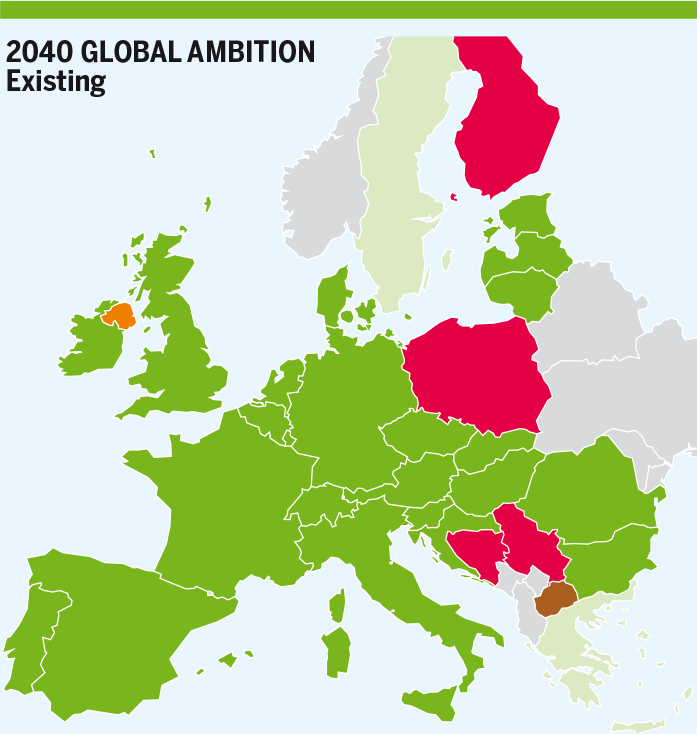
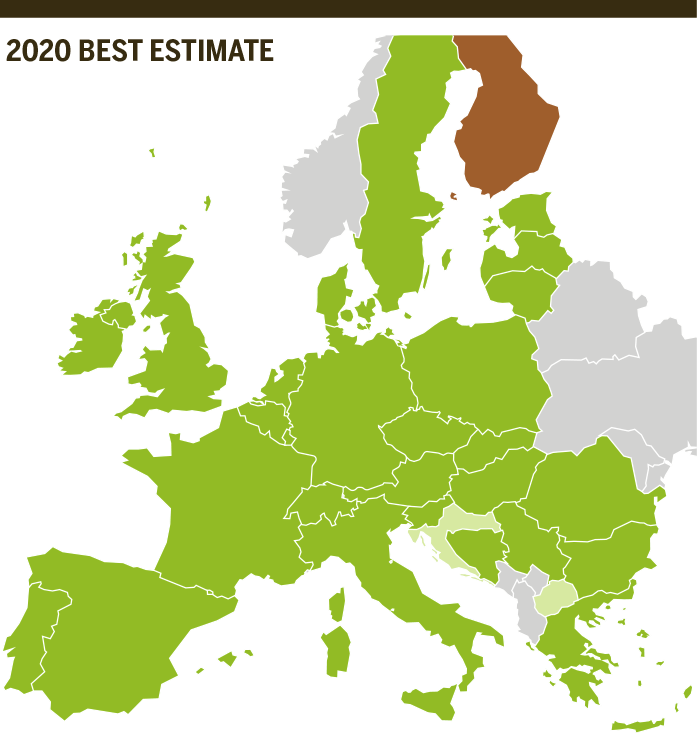
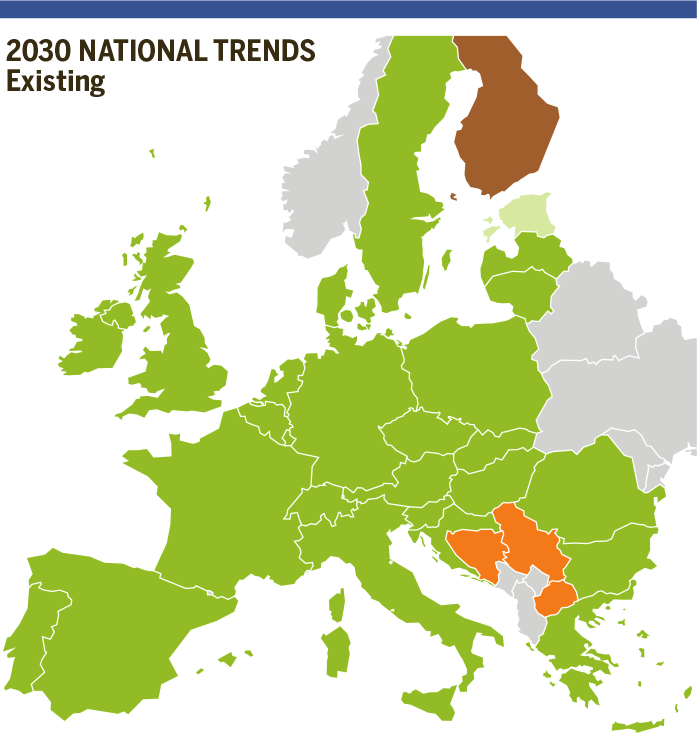
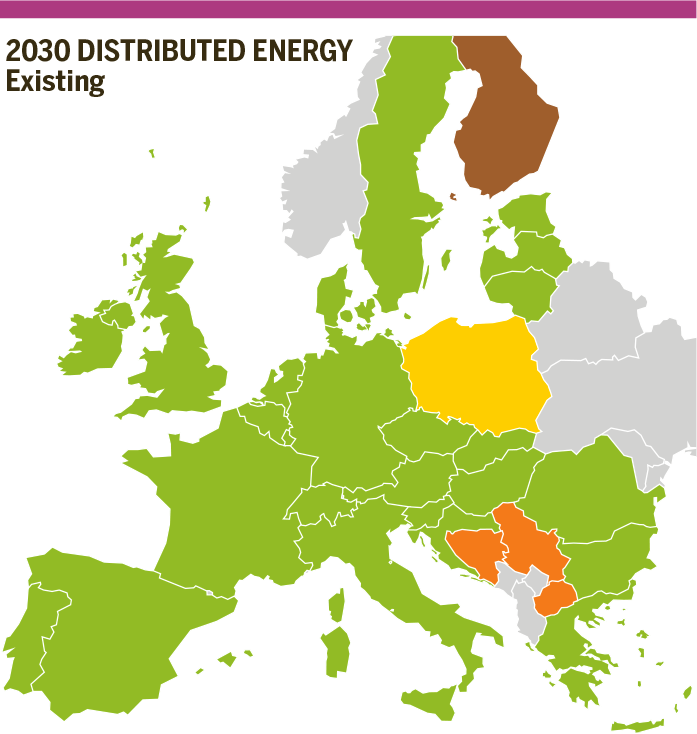
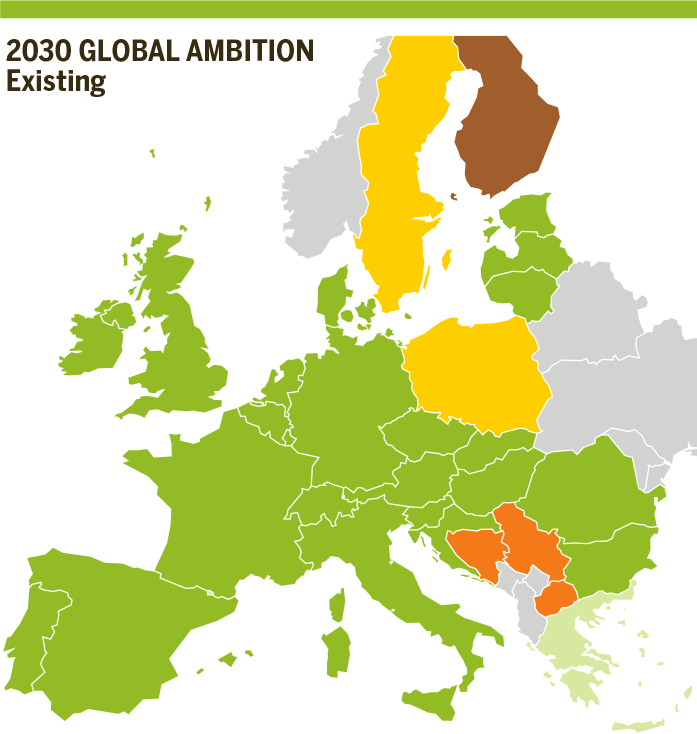
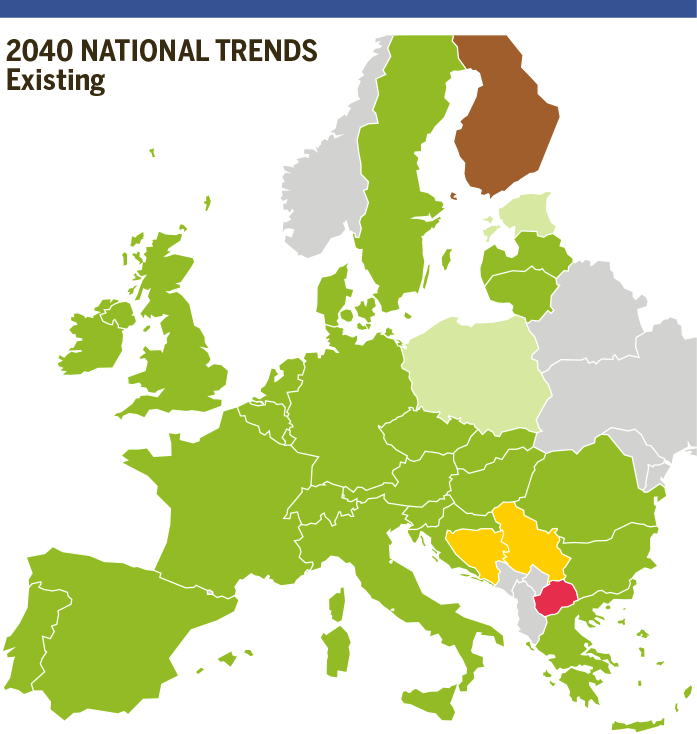
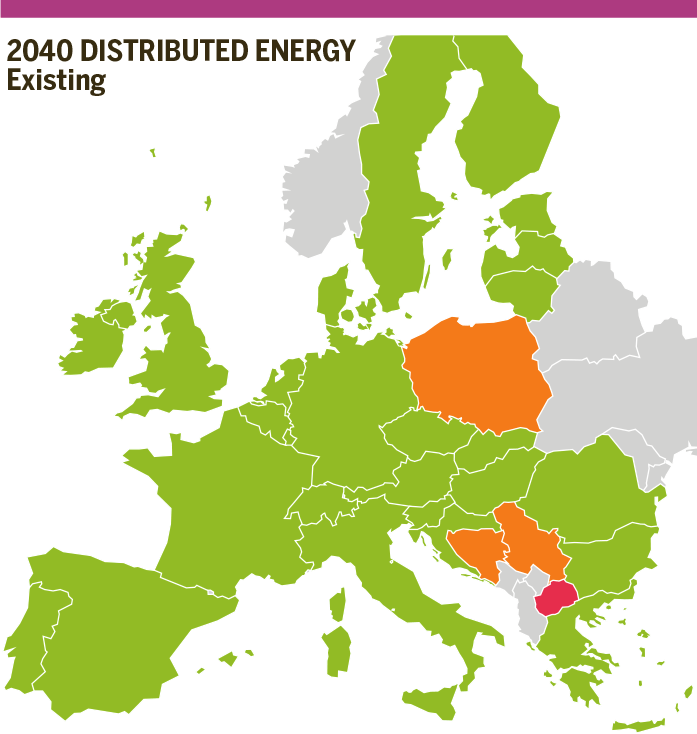
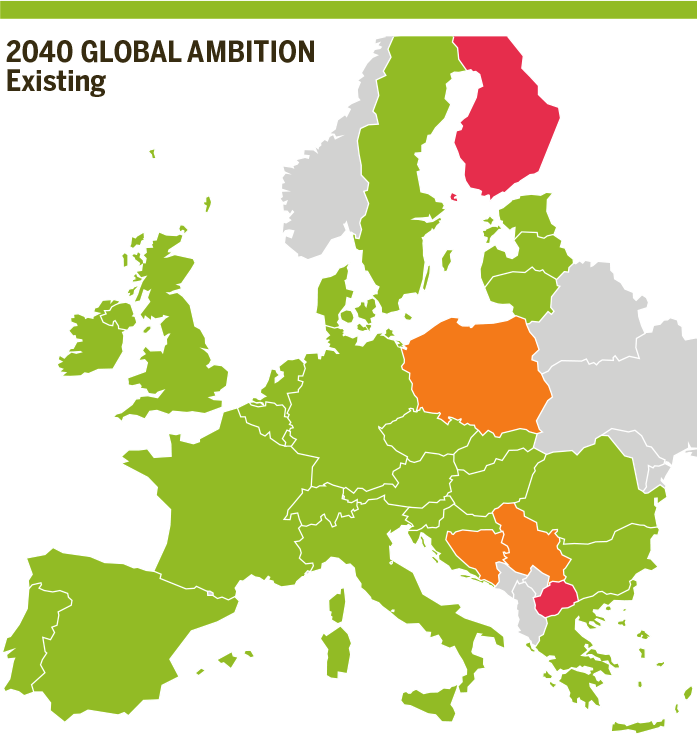
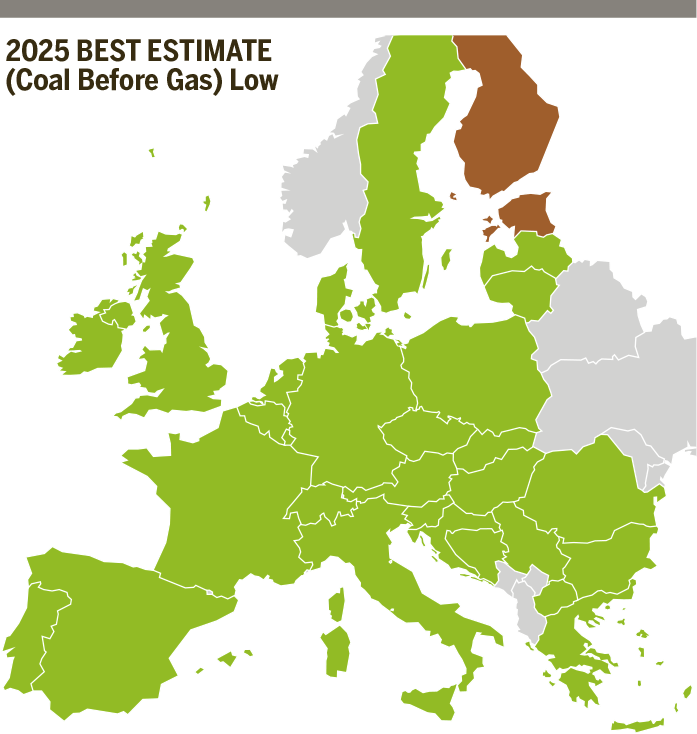
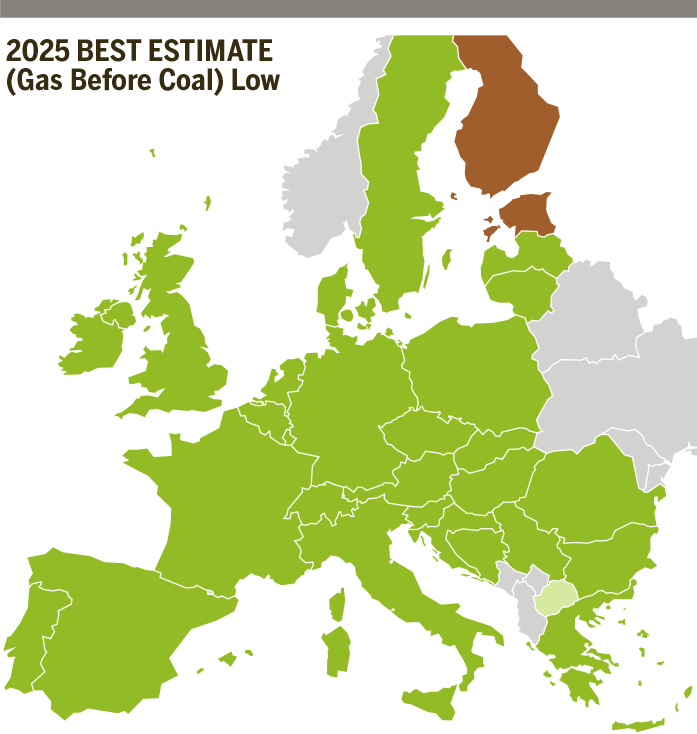
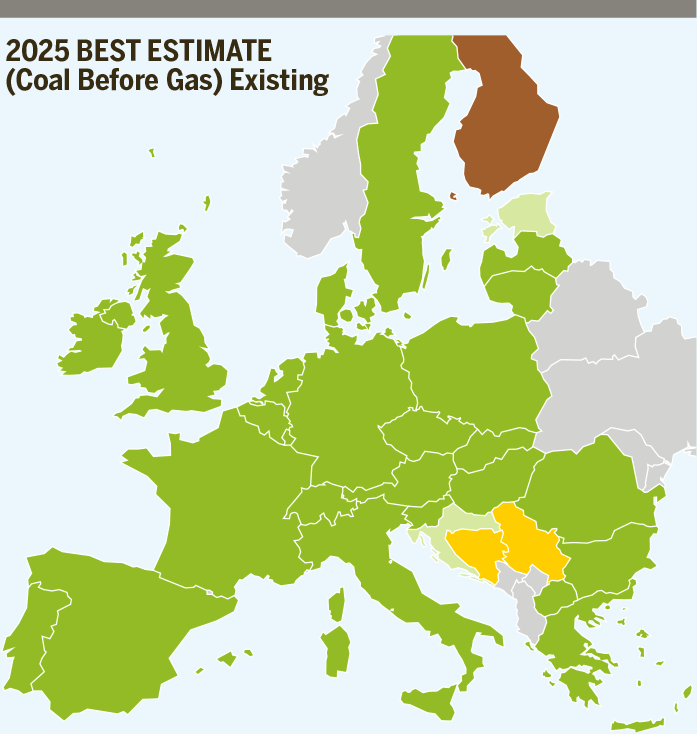
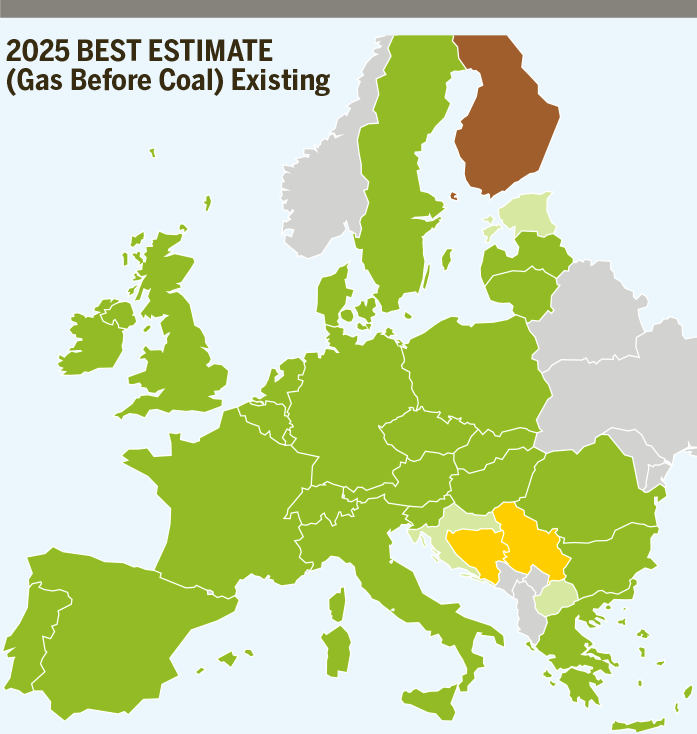
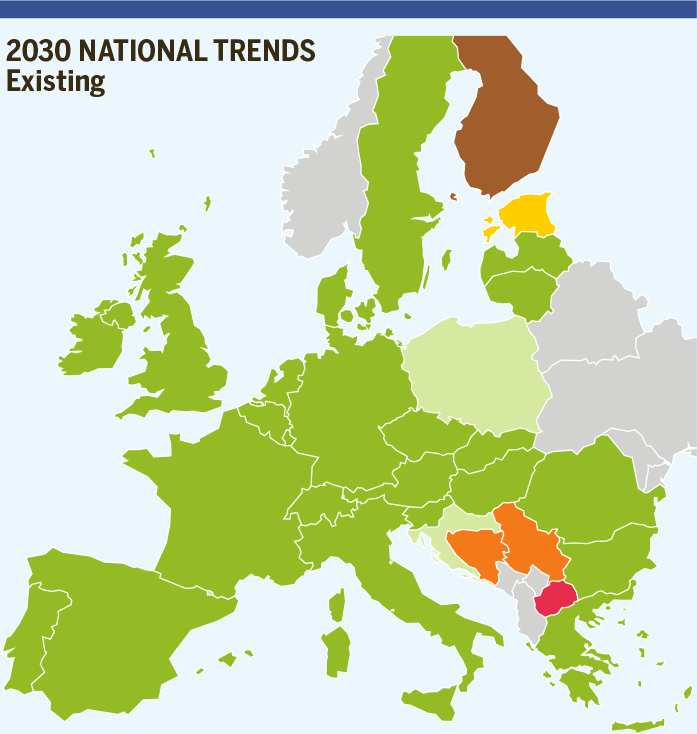
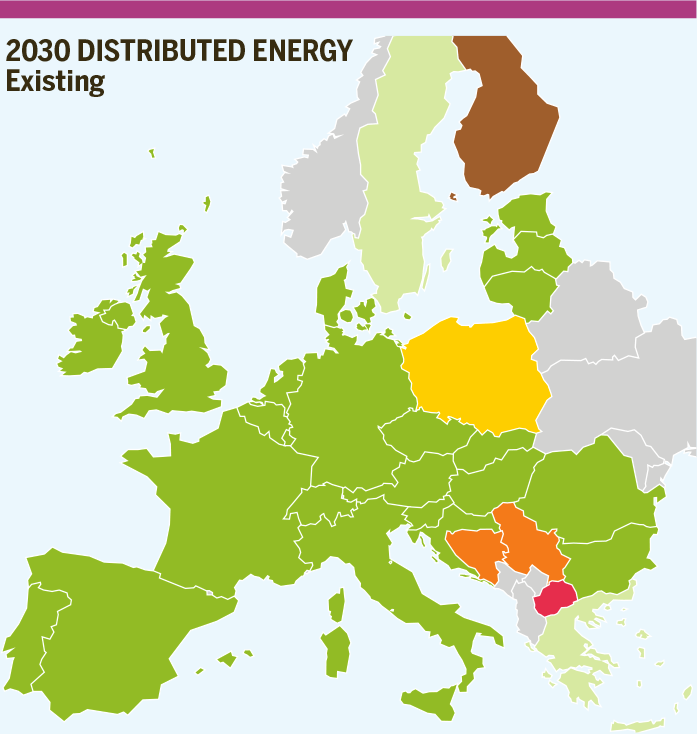
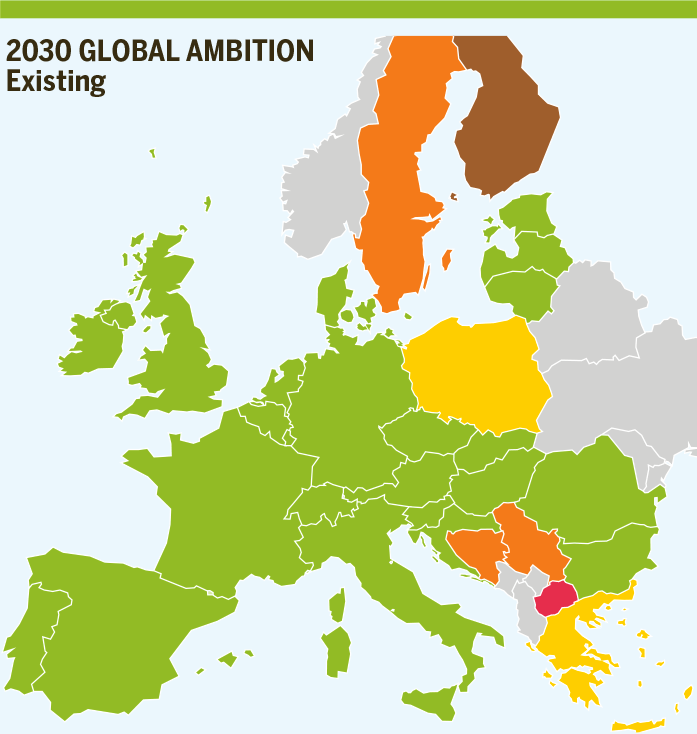
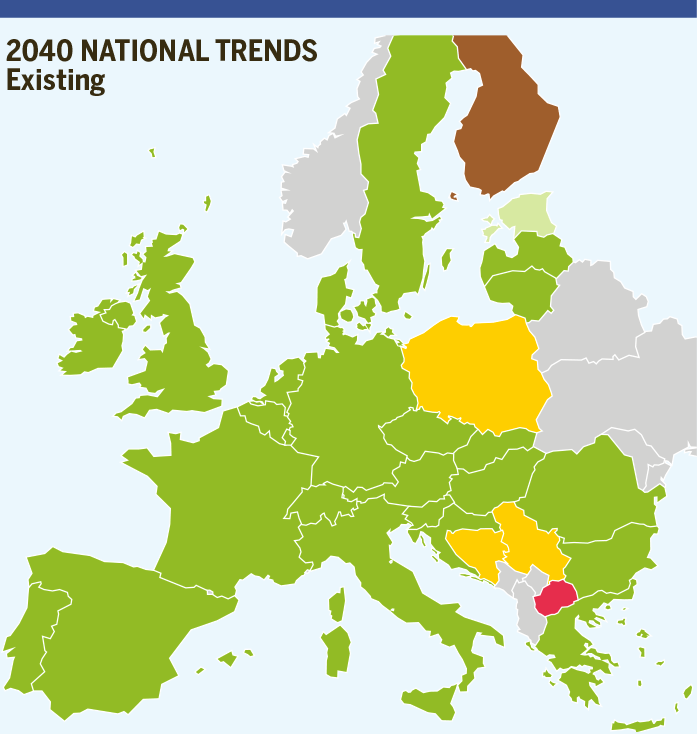
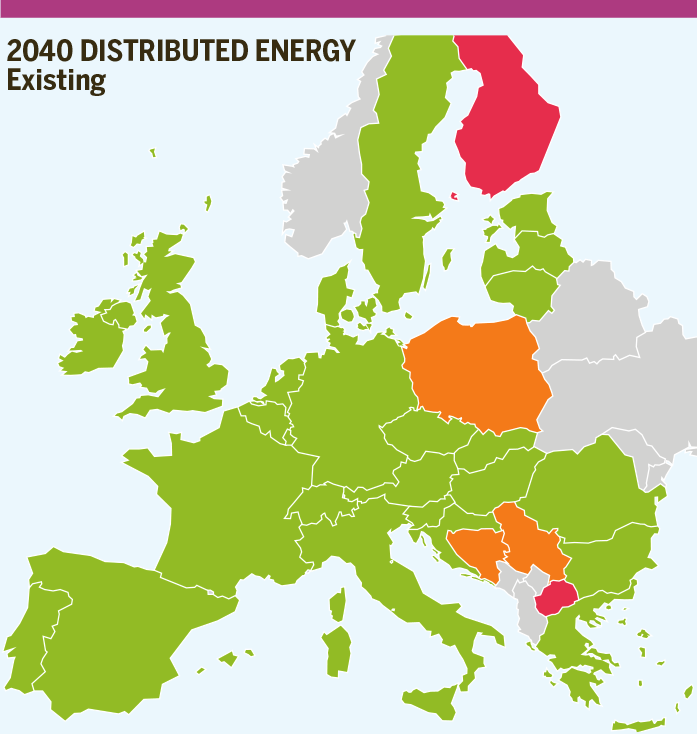
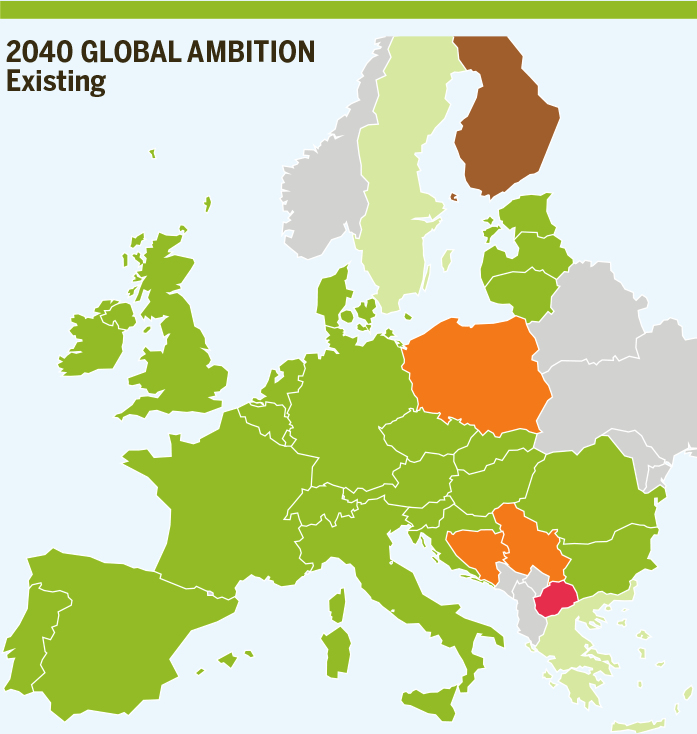
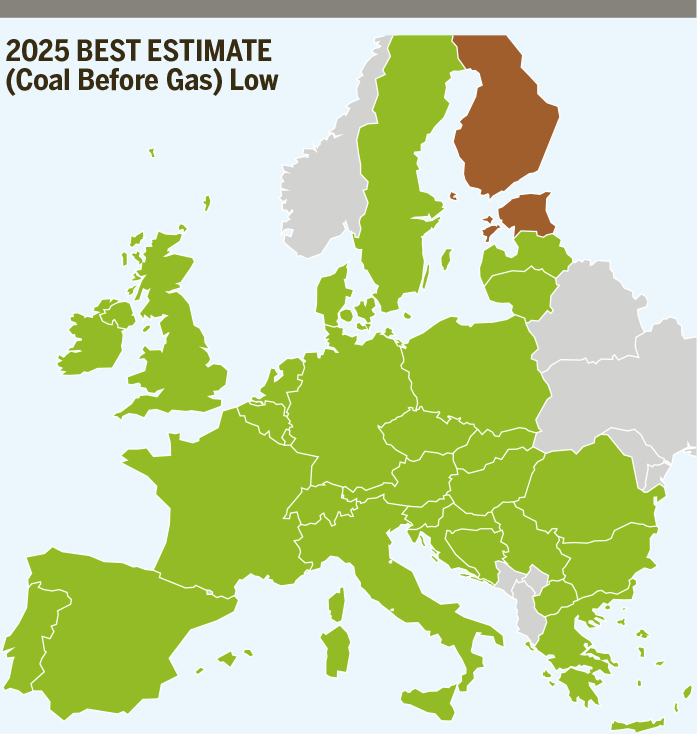
Simulation results are in line with the assessment of climatic stress conditions without transit disruption assessment. Apart from the countries already facing risk of demand curtailment, results show a high impact in Finland and to a lesser extend in Estonia. Figure 4.80 shows the evolution of the Existing infrastructure level described below.
2025
Coal Before Gas/Gas Before Coal
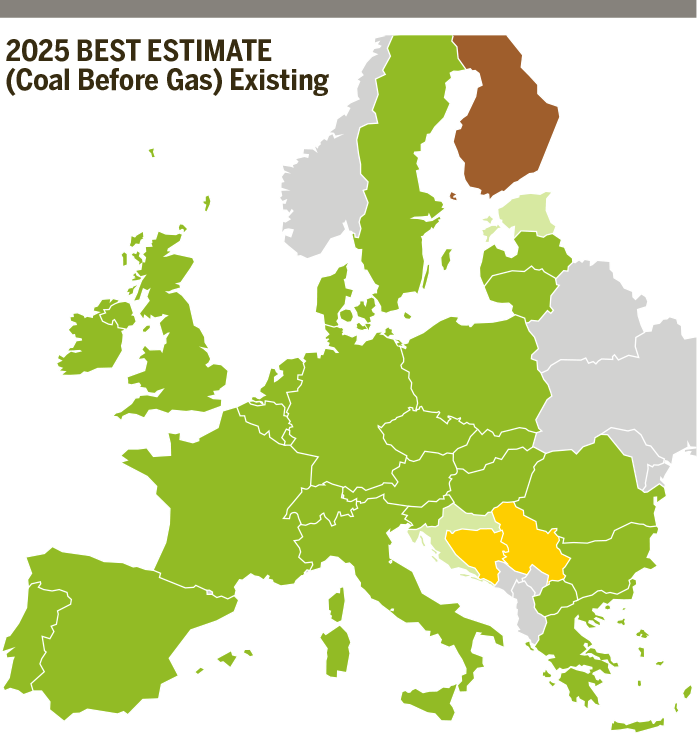
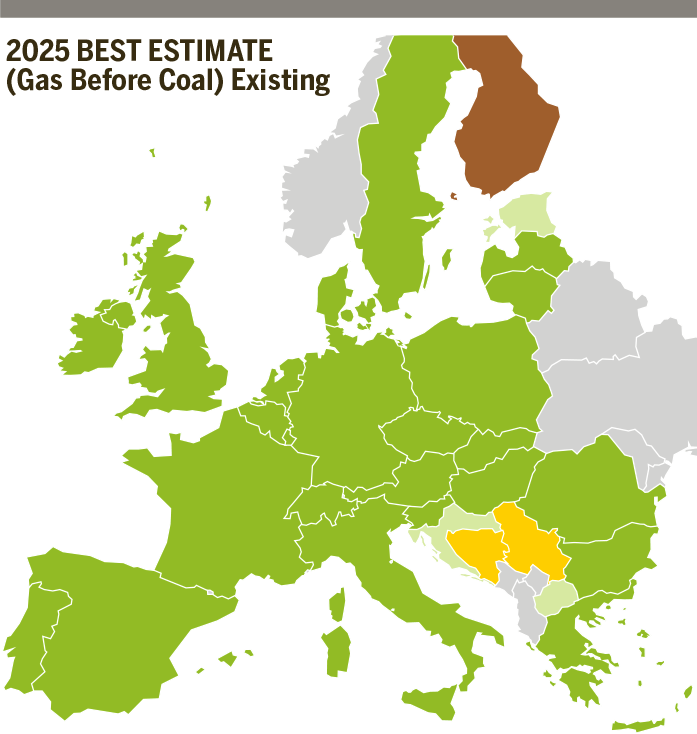
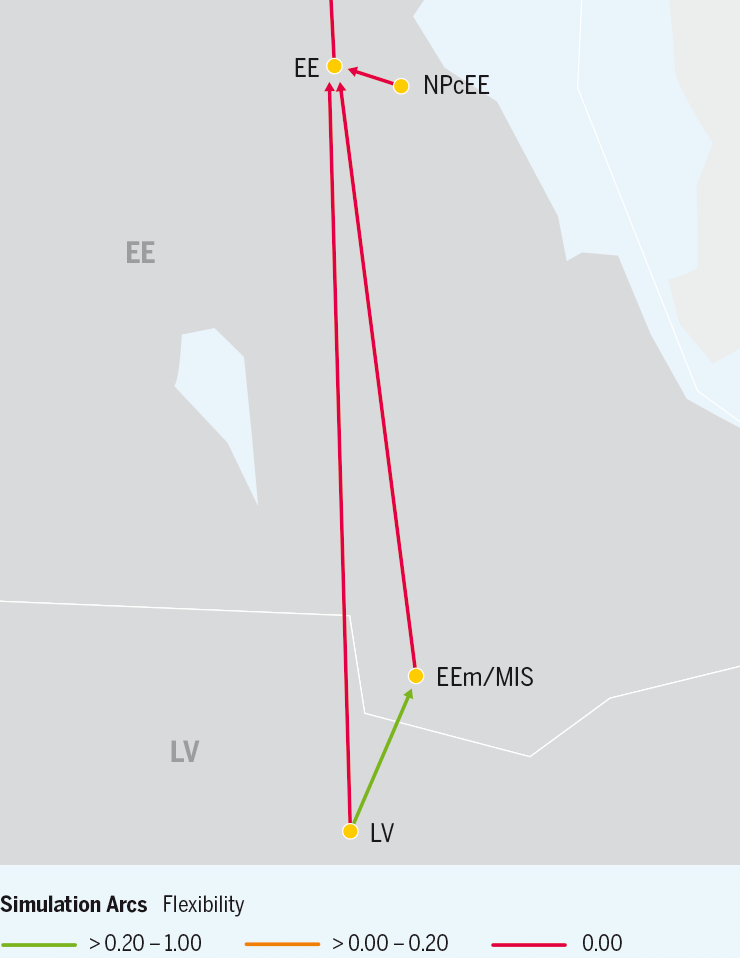
Results show that Finland is exposed to a high risk of demand curtailment and to a lesser extent Estonia is exposed to a risk of demand curtailment as well in both scenarios. There are some infrastructure limitations in the area, restricting the flow from Latvia to Estonia and from Estonia to Finland, combined with the absence of indigenous production in Finland and very limited production in Estonia coming from biomethane.
2030-2040
National Trends
Simulation results are in line with 2025 scenarios, with limited demand variations in Finland and Estonia from 2025 onwards. The capacity from Latvia to Estonia and from Estonia to Finland is fully used, showing some infrastructure limitation in the area. Additionally, the very limited indigenous production in Finland and Estonia coming from biomethane does not help to cope with the risk of demand curtailment.
COP 21 scenarios
Distributed Energy and
Global Ambition
Simulation results show that Estonia-Finland cooperation is used to its full capacity through the Baltic-connector.
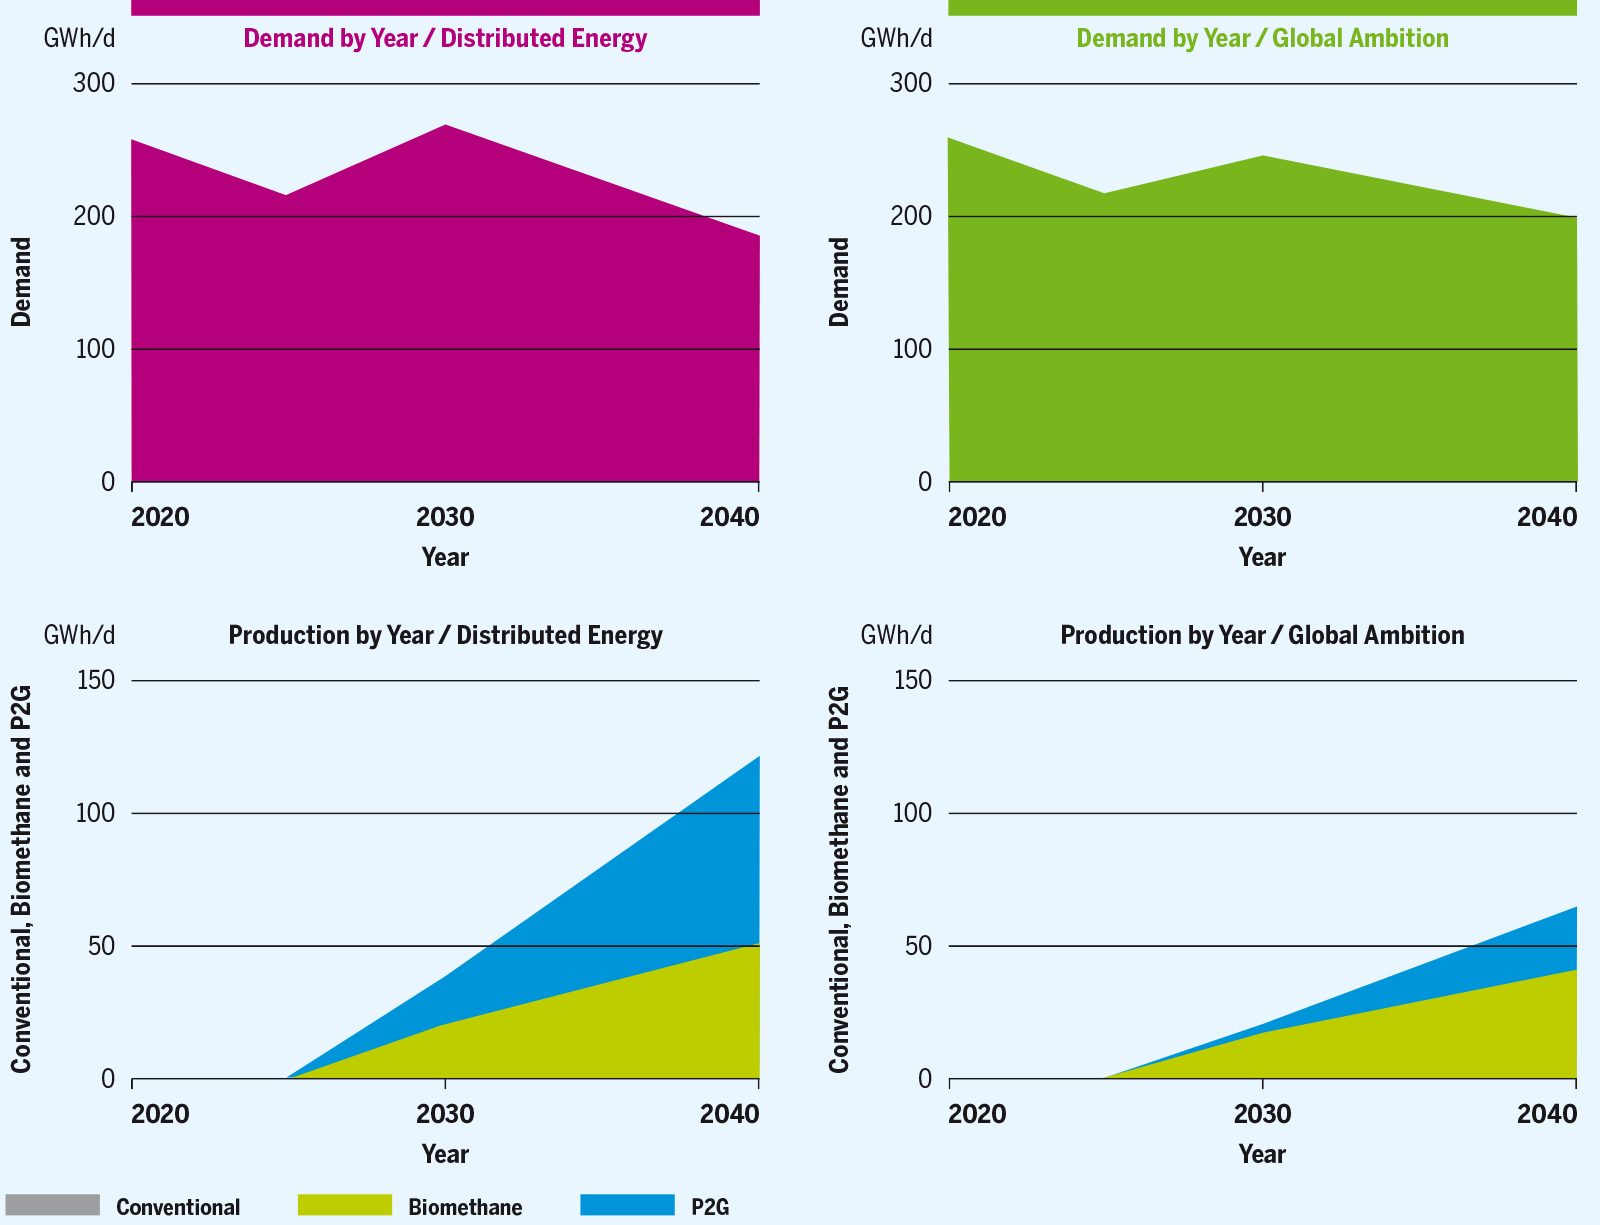
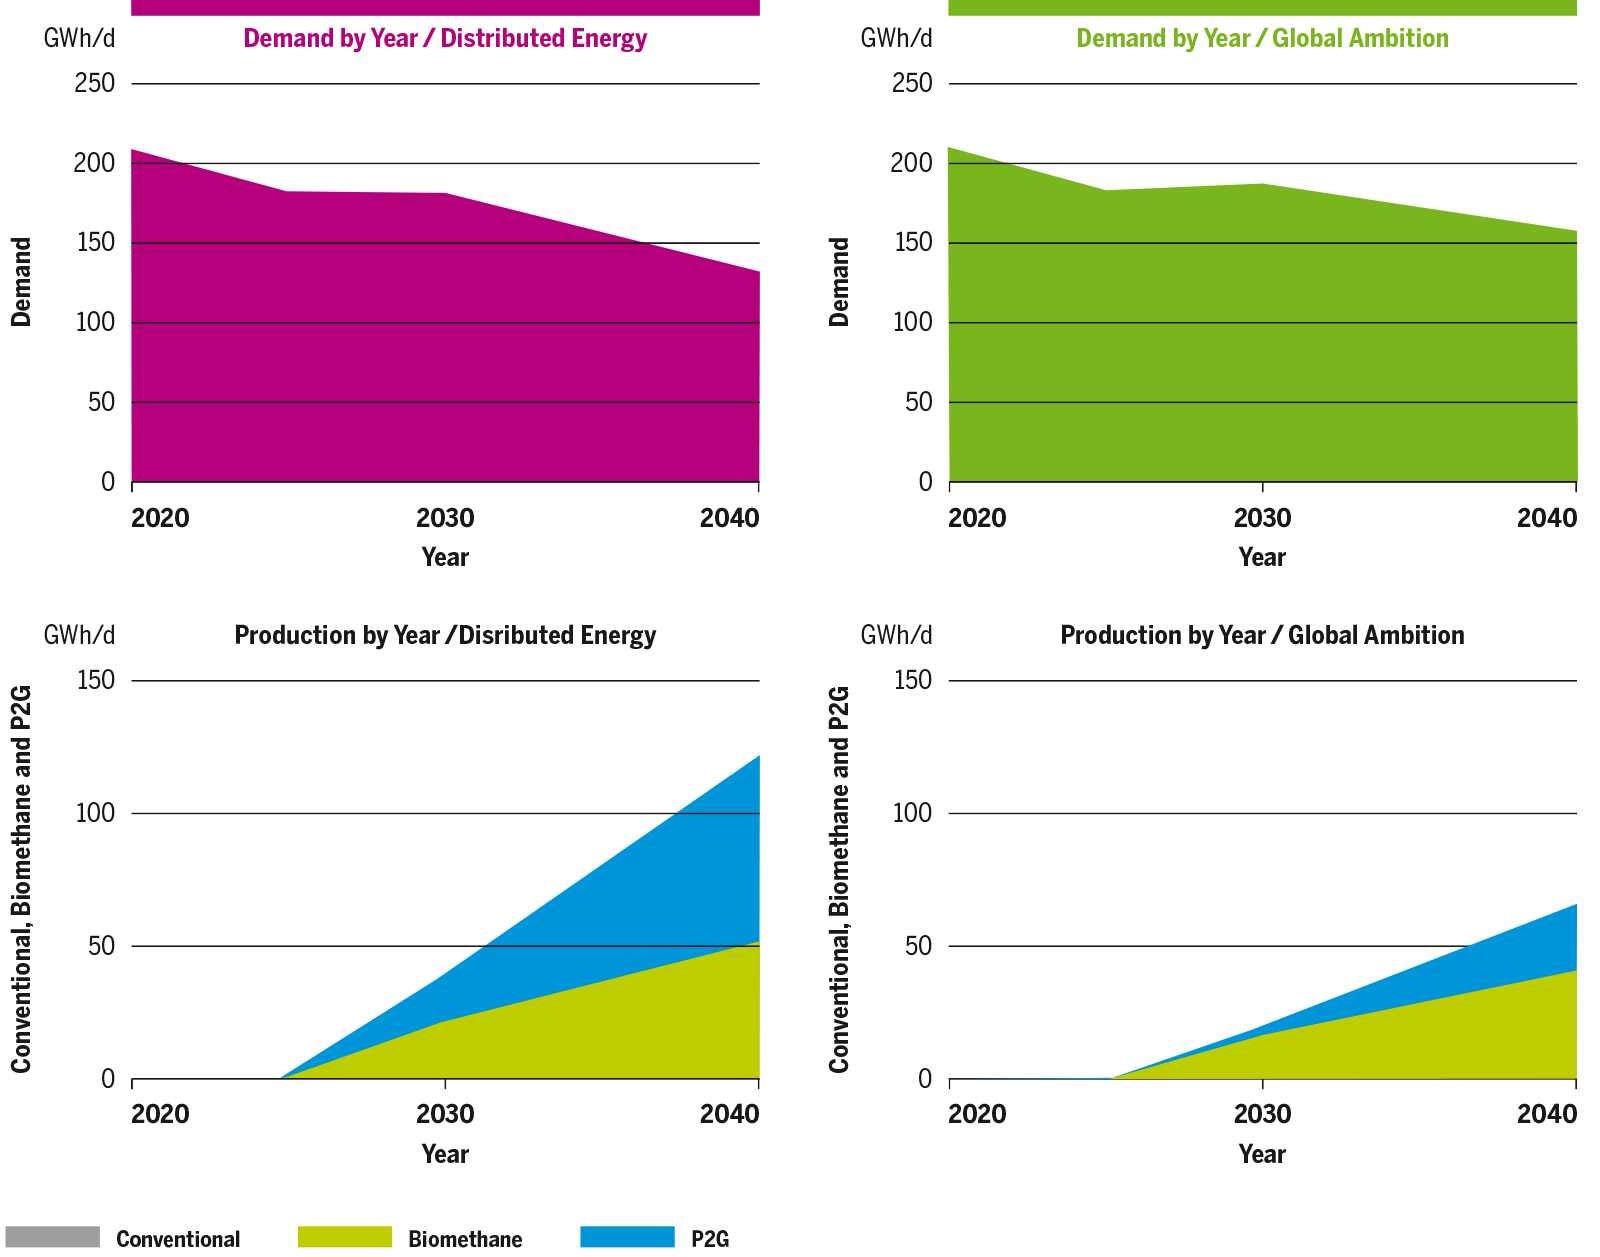
Finland reduces its risk of demand curtailment in 2030 compared to National Trends, from 86 % to 74 % in Distributed Energy and 79 % in Global Ambition, thanks to the increase of indigenous production coming from renewables (biomethane and power to gas). In 2040, Finland further decreases its risk of demand curtailment compared to National Trends scenario, from 84 % to 18 % in Distributed Energy and 51 % in Global Ambition, thanks to a further increase of the indigenous production coming from renewables (biomethane and power to gas) in both scenarios and a decrease of its demand. See Figures 4.78 and 4.79.
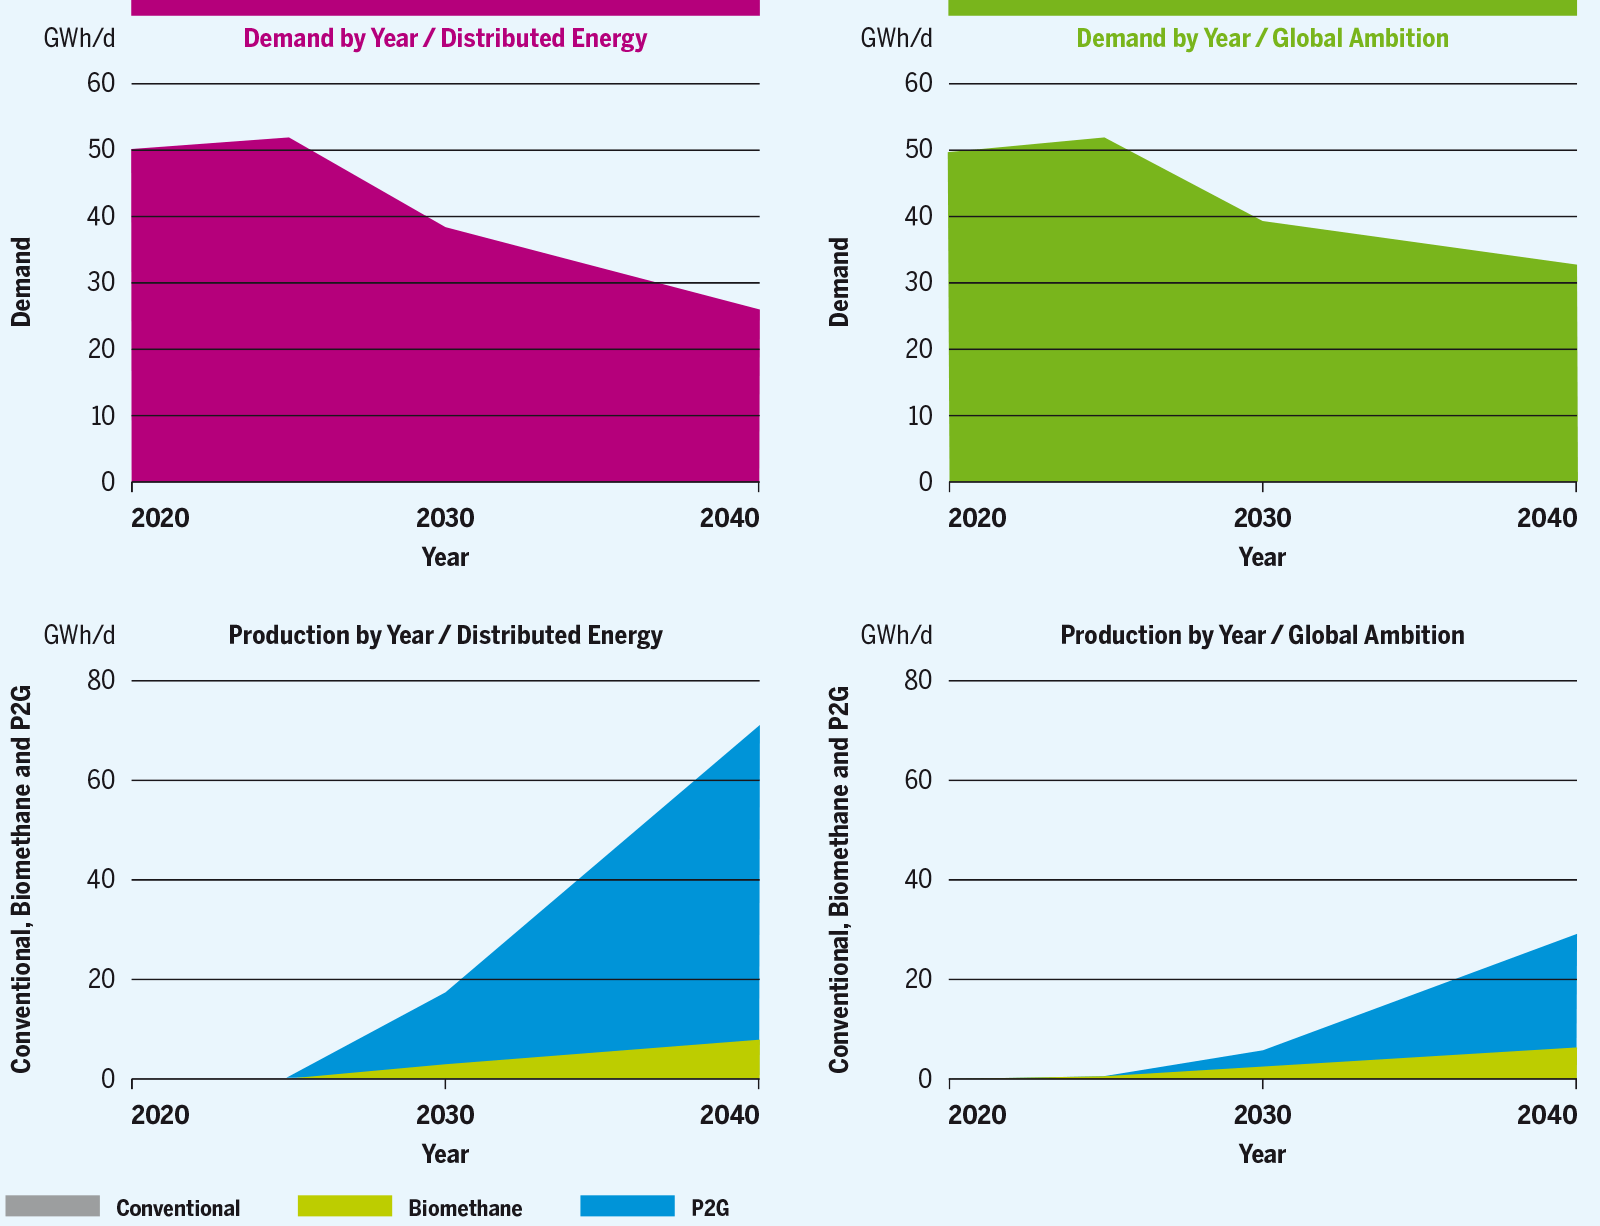
As a result of the cooperation with Finland, Estonia is exposed to lesser extent to a risk of demand curtailment in 2030 for both scenarios. In 2040, Estonia is not exposed to risk of demand curtailment reaching a significant level of remaining flexibility in both scenarios thanks to lower demand combined with higher indigenous production coming from renewables (biomethane and power to gas).
Figure 4.78: Peak demand and production in Finland in COP 21 scenarios in GWh/d.
Figure 4.79: Peak demand and production in Estonia in COP 21 scenarios in GWh.

Figure 4.80: Existing infrastructure level: Baltics States and Finland transit disruption under peak day situation.
Low Infrastructure level
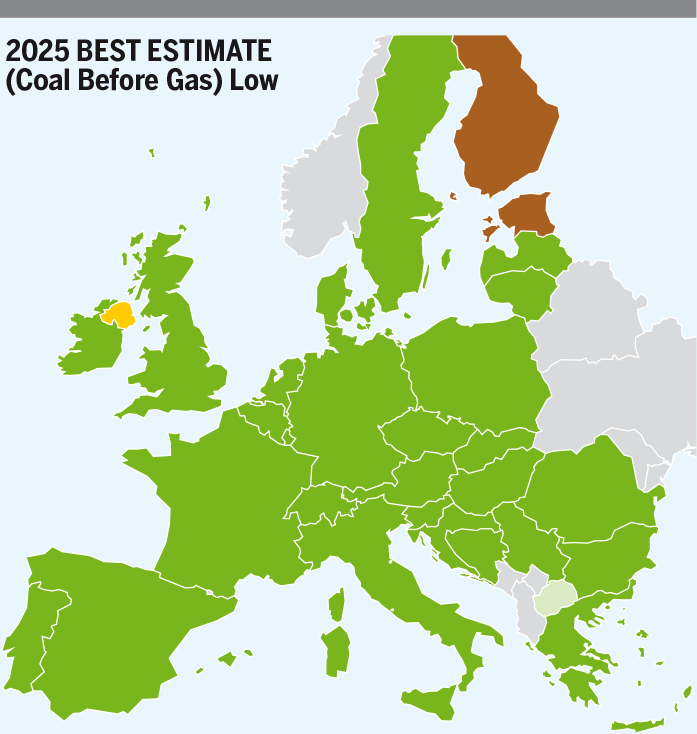
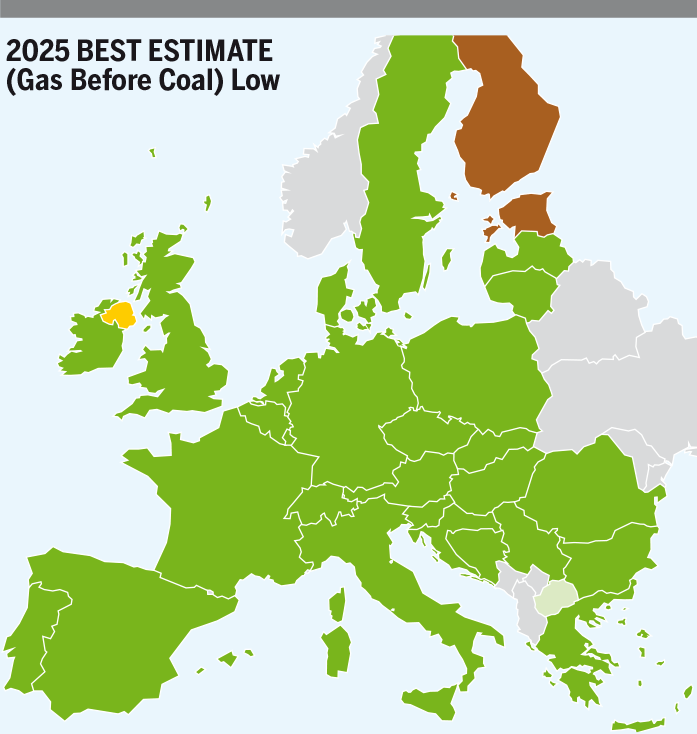
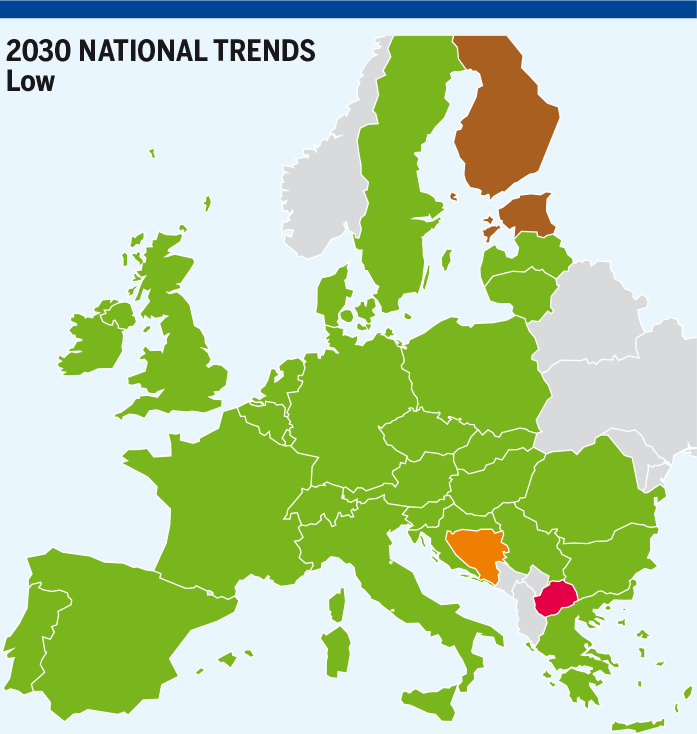
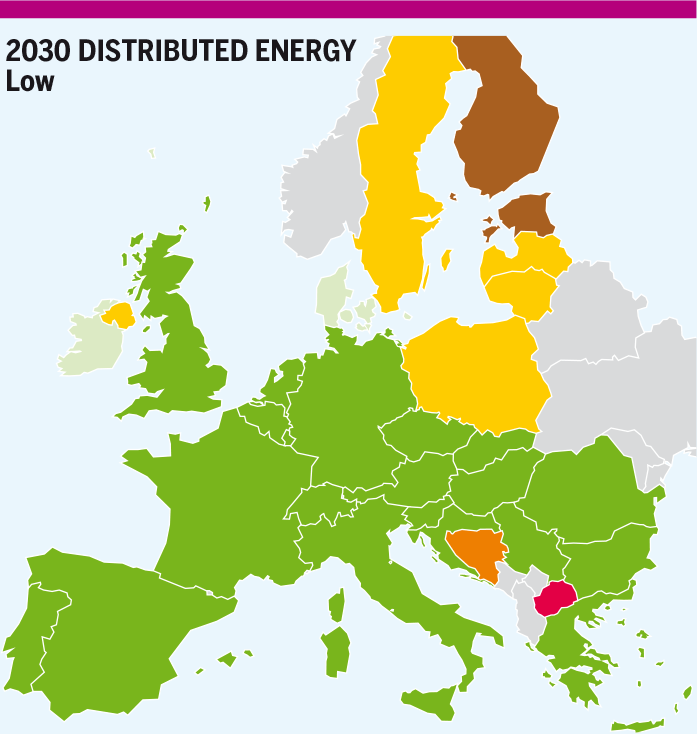
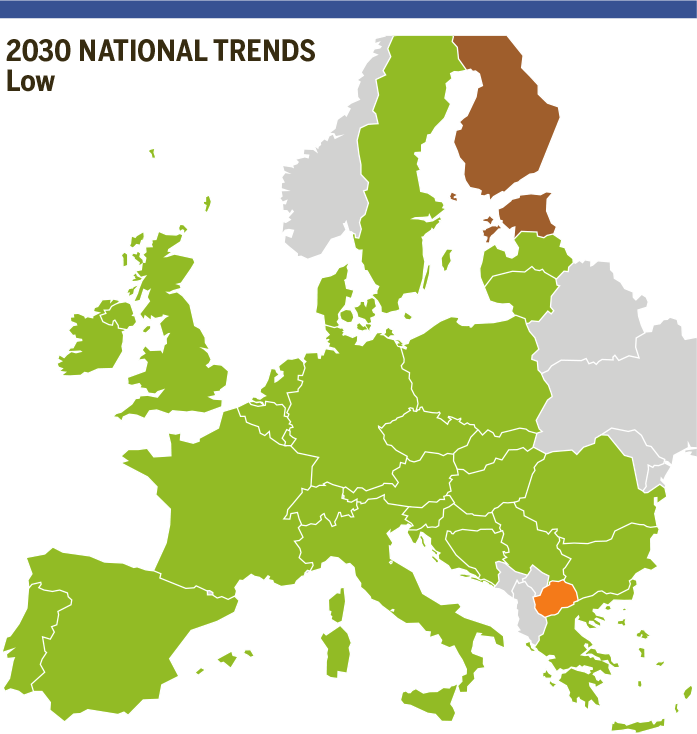
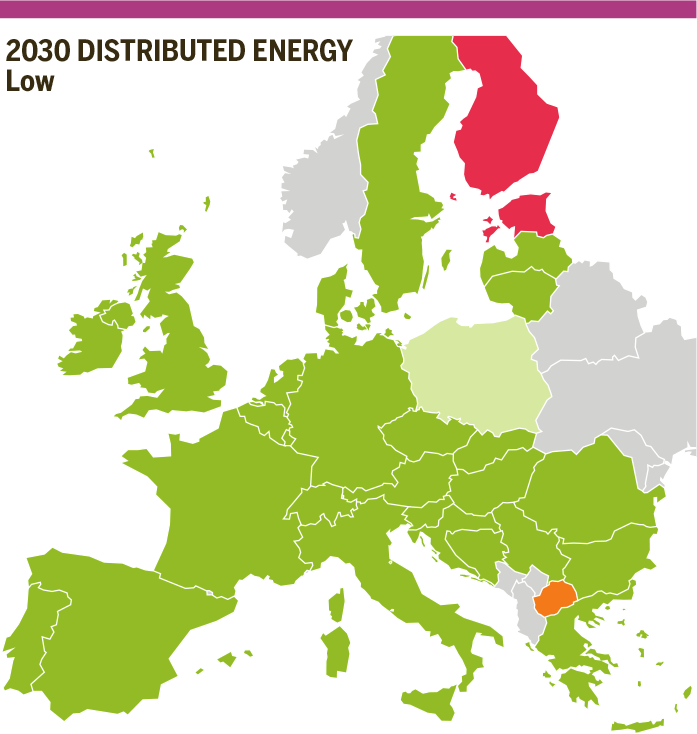
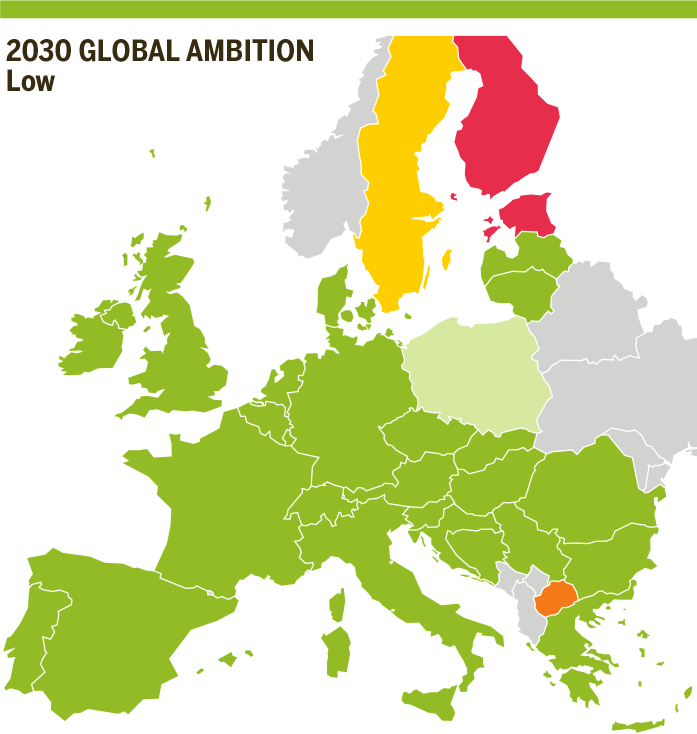
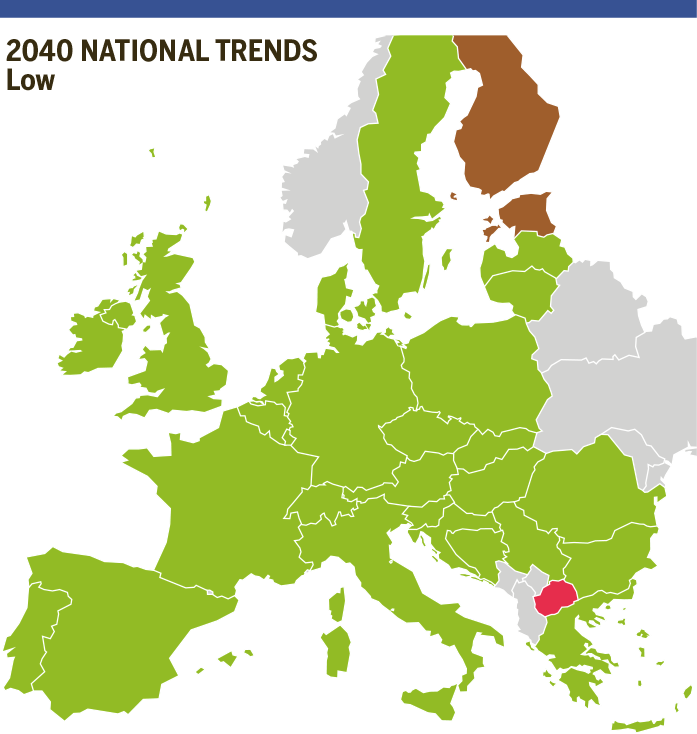
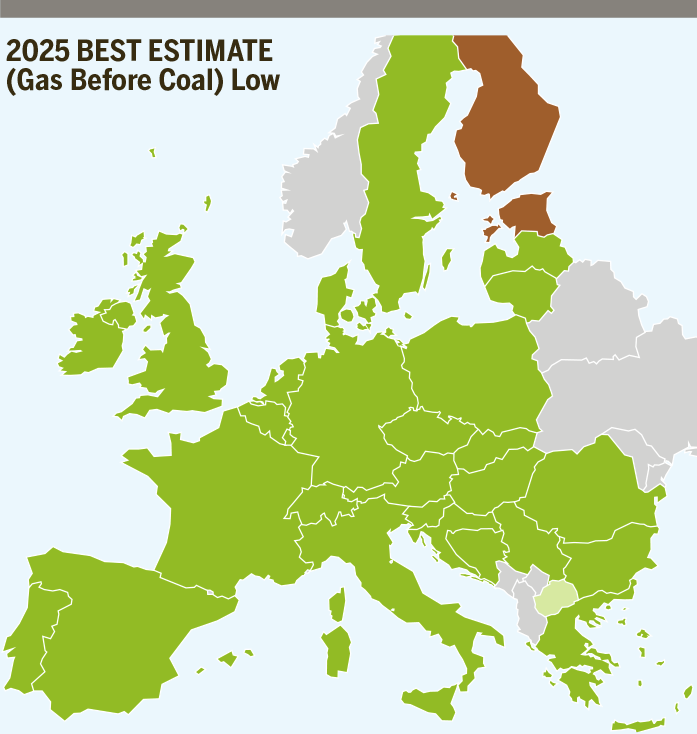
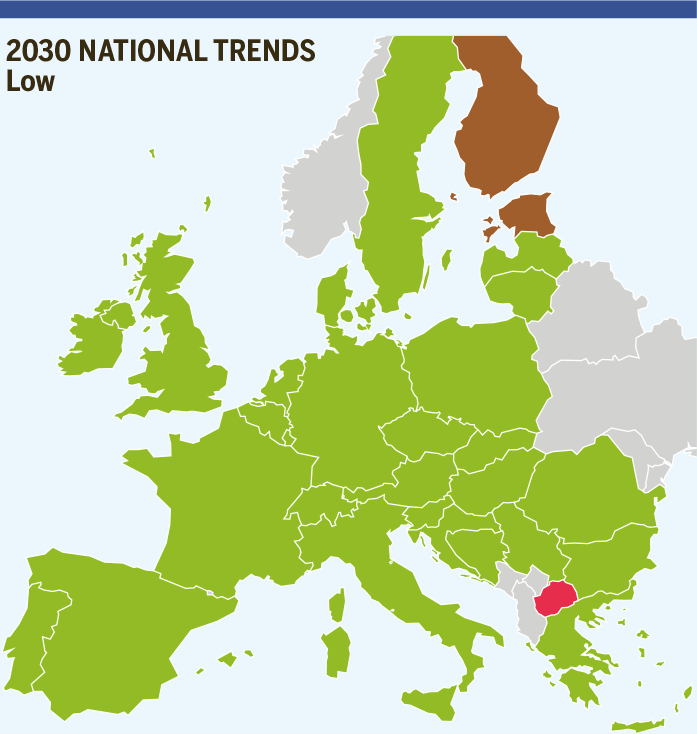
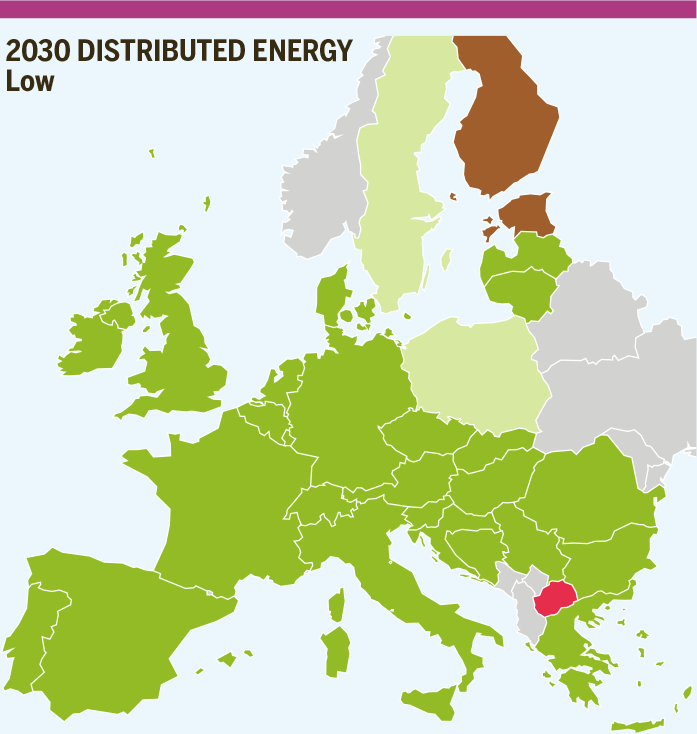
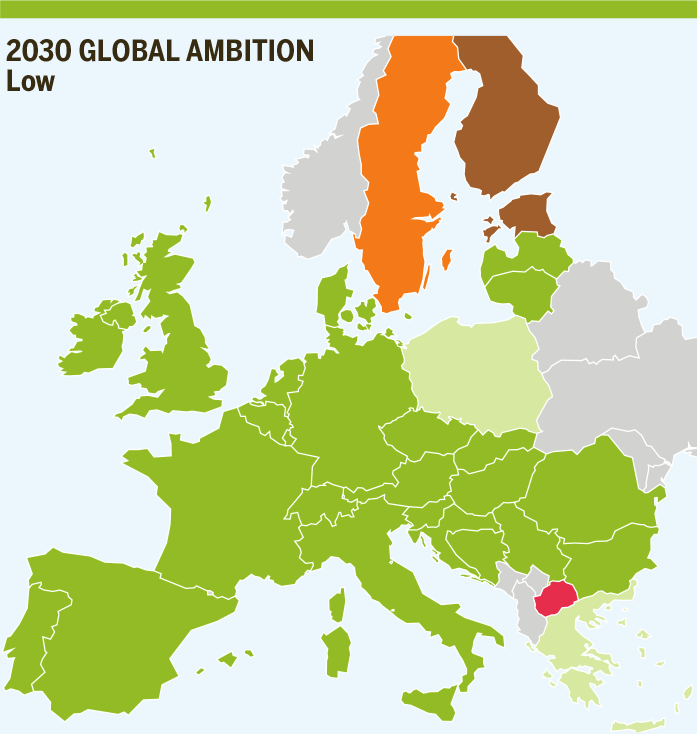
Simulation results show that the commissioning of some FID projects increases the cooperation between neighbouring countries in the Baltic states area. Nevertheless, there is still a lack of infrastructure in the area. Figure 4.81 shows the Low Infrastructure level results described below.
2025
Coal Before Gas/Gas Before Coal
Simulation results show that Finland and Estonia are exposed to a high risk of demand curtailment in both scenarios.
The risk of demand curtailment in Finland decreases from 88 – 85 % (Coal before Gas and Gas before Coal respectively) in Existing infrastructure level to 73 – 75 % in Low infrastructure level thanks to the commissioning of the second capacity increment of the FID Project Balticconnector.
The capacity increment in Balticconnector increases the cooperation between Estonia and Finland, as a result Estonia shares Finland’s risk of demand curtailment up to the same extend 72 – 74 % (Coal before Gas and Gas before Coal respectively).
Additionally, there is an infrastructure limitation towards Estonia, restricting the flow from Latvia to Estonia, combined with no indigenous production in Finland and very low in Estonia coming from biomethane.
2030 – 2040
National Trends
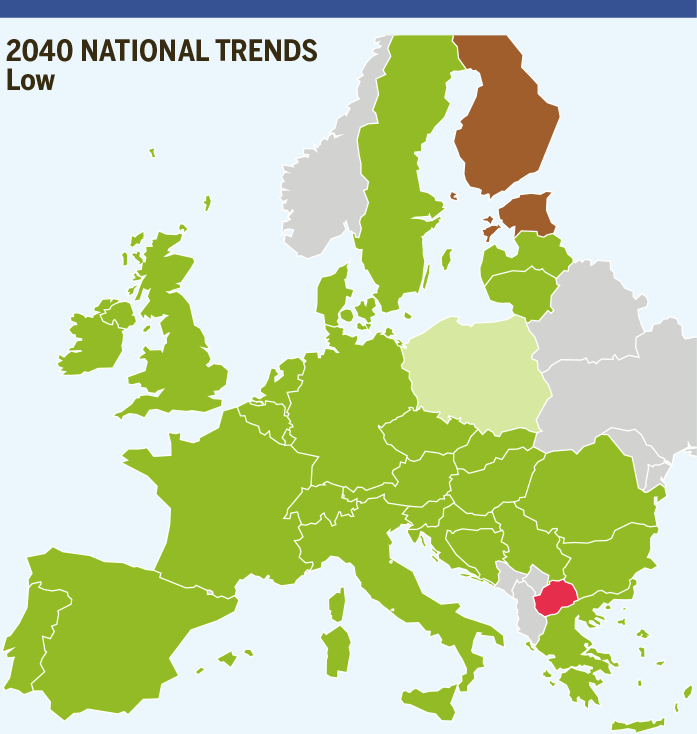
Simulation results are in line with 2025 scenarios. The increment capacity in Balticconnector increases the cooperation between Estonia-Finland, as a result Finland decreases its risk of demand curtailment, from 86 – 84 % (2030 – 2040 respectively) in Existing infrastructure level to 74 – 71 % (2030 – 2040 respectively) in Low infrastructure level.
Nevertheless, Estonia shares Finland’s risk of demand curtailment up to the same extend 72 – 70 % (2030 – 2040 respectively). The capacity from Latvia to Estonia is fully used, showing infrastructure gaps in the area, combined with very low indigenous production in Finland and Estonia coming from biomethane.
COP 21 scenarios
Distributed Energy and
Global Ambition
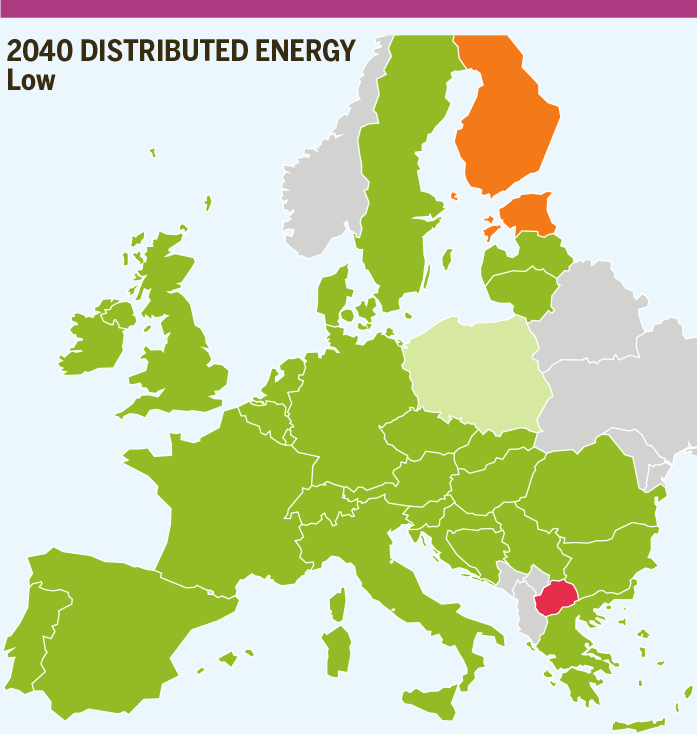
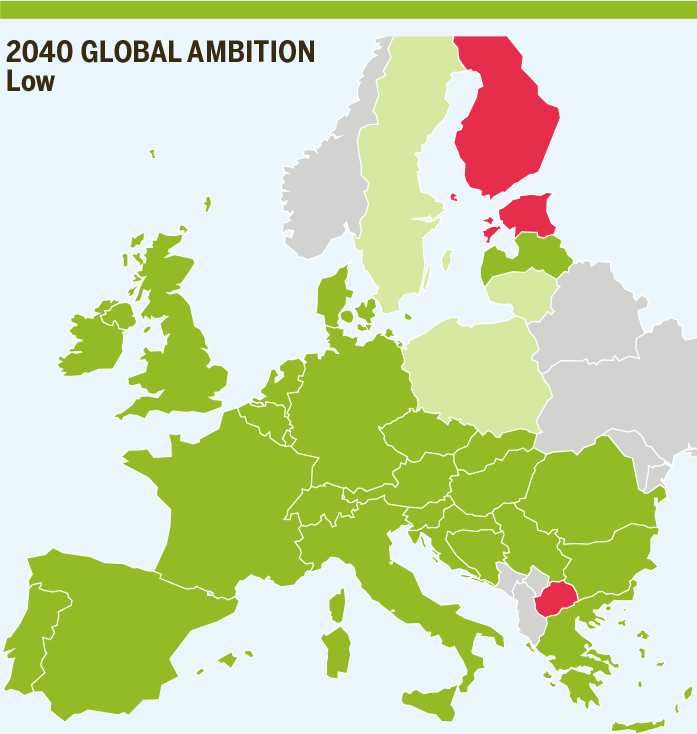
In 2030,as for National Trends and 2025 scenarios, the increment capacity in Balticconnector increases the cooperation between Estonia-Finland, as a result Finland decreases its risk of demand curtailment while Estonia shares Finland’s risk of demand curtailment up to the same extent.
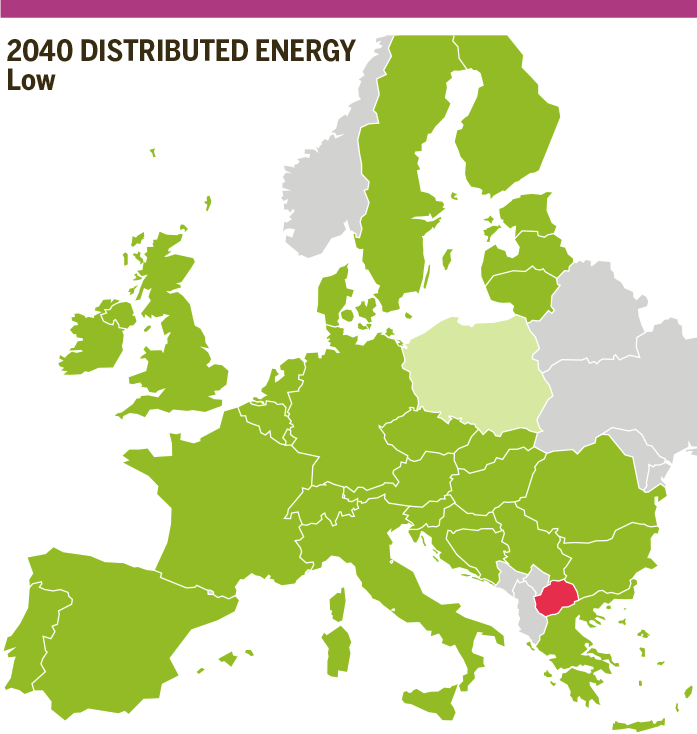
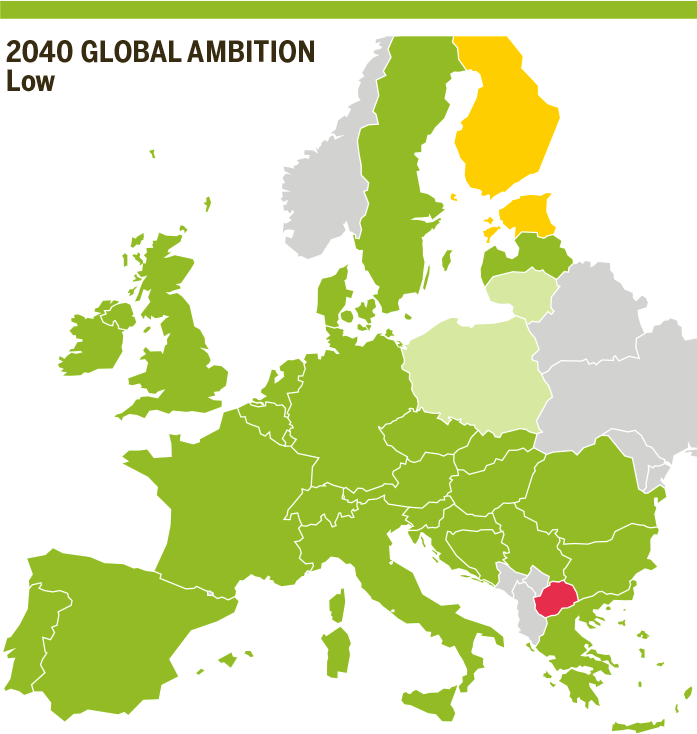
In 2040 the situation improves, fully mitigating the risk of demand curtailment in Distributed Energy and reducing the risk of demand curtailment in Global Ambition, thanks to the increment capacity in Balticconnector together with the reduction of the demand and increase of the indigenous production in Finland and Estonia coming from renewables (biomethane and power to gas).
Moreover, Lithuania faces a limited risk of demand curtailment in Distributed Energy 2030 and Global Ambition 2030 – 2040, even though is able to satisfy its demand, driven by the GIPL project to be commissioned in 2021 that connects Poland to Lithuania and therefore enables the cooperation between both countries from 2022 onwards.
Latvia faces a limited risk of demand curtailment in Distributed Energy and Global Ambition 2030 scenario driven by its cooperation with Estonia and Lithuania. In 2040, the demand in Estonia (in both COP21 scenarios) and Lithuania (only in Distributed Energy scenario) has a remarkable decrease combined with an increase of their national production coming from renewables (biomethane and power to gas) therefore is not exposed to a risk of demand curtailment.

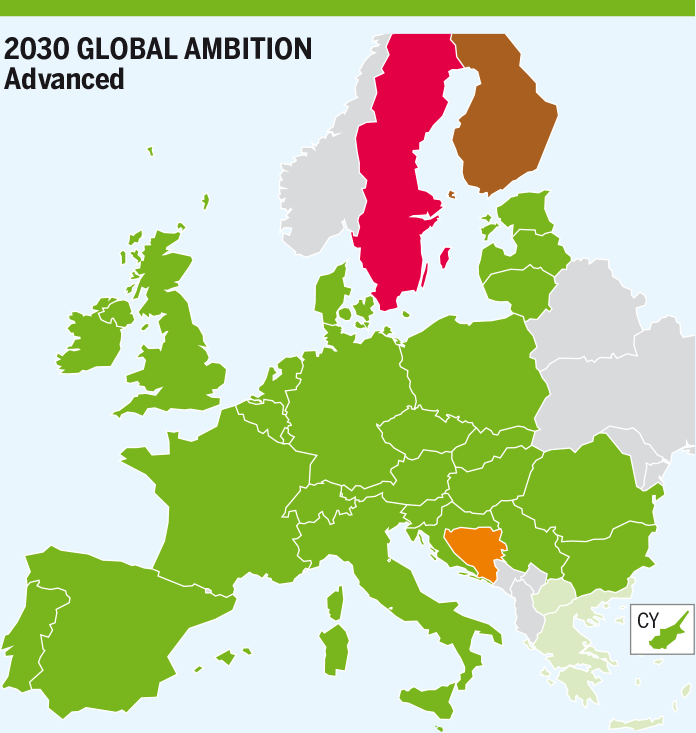
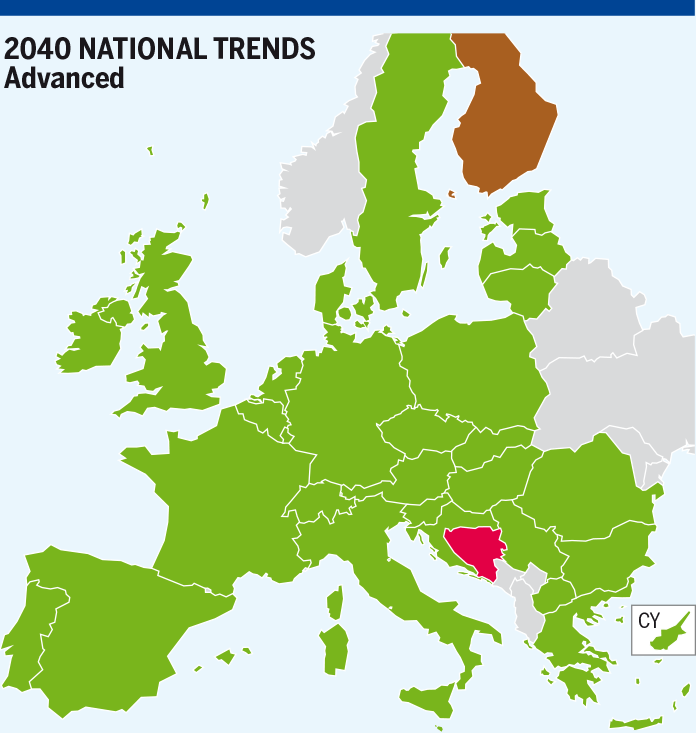
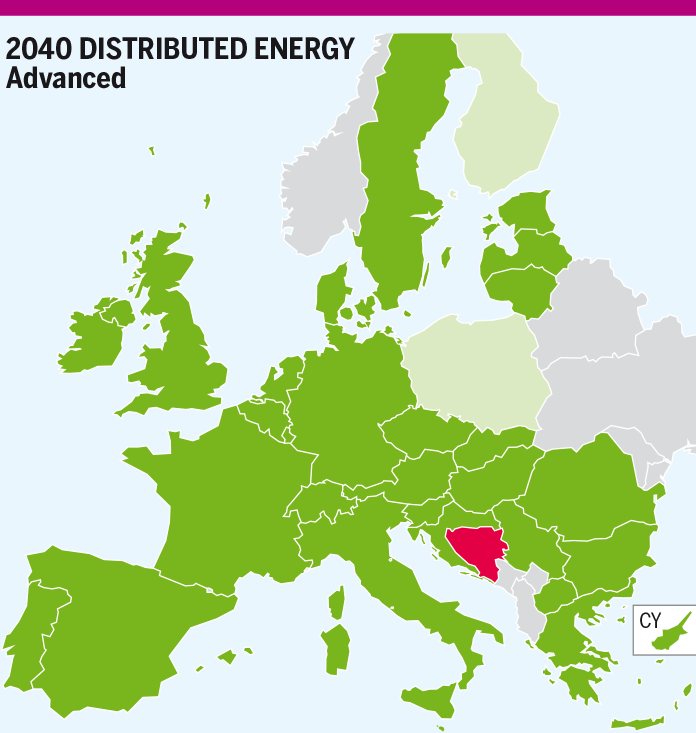
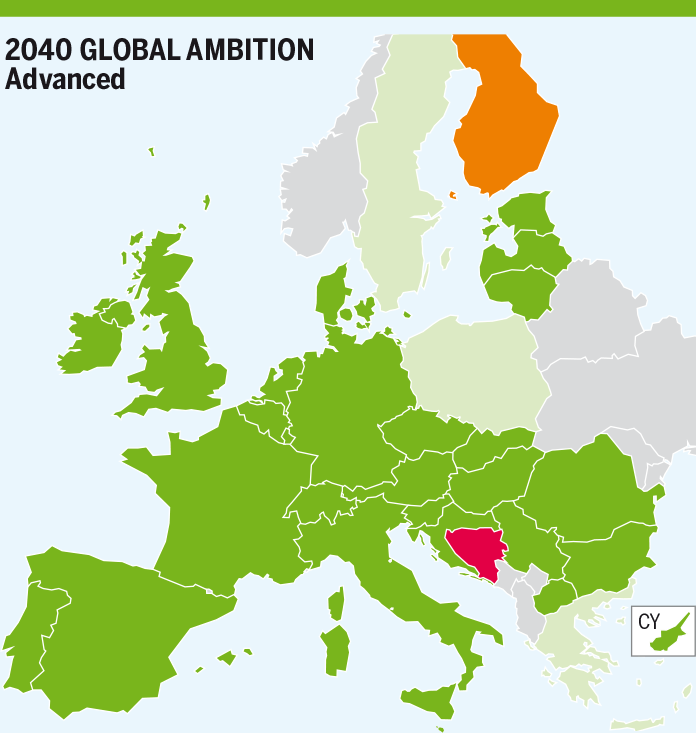
Figure 4.81: Low infrastructure level: Baltics States and Finland transit disruption under peak day situation.
Advanced Infrastructure level
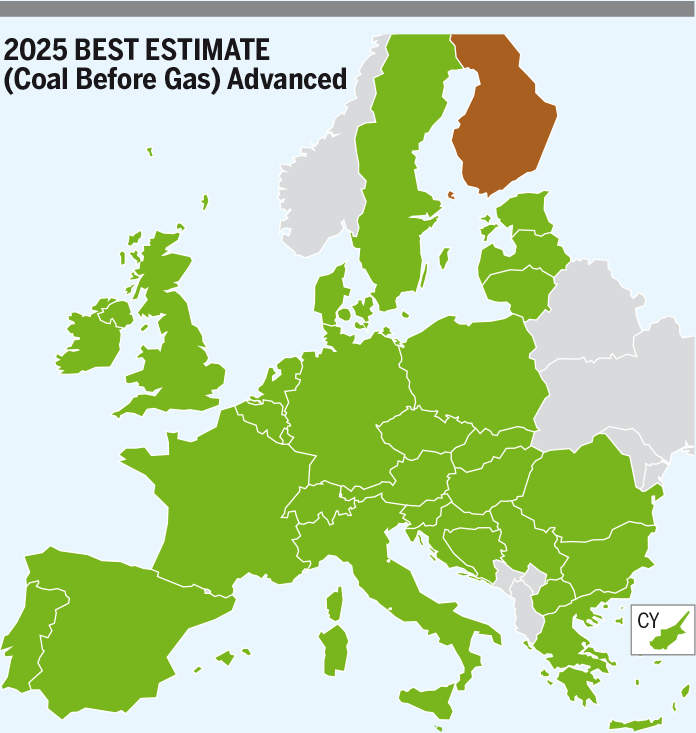
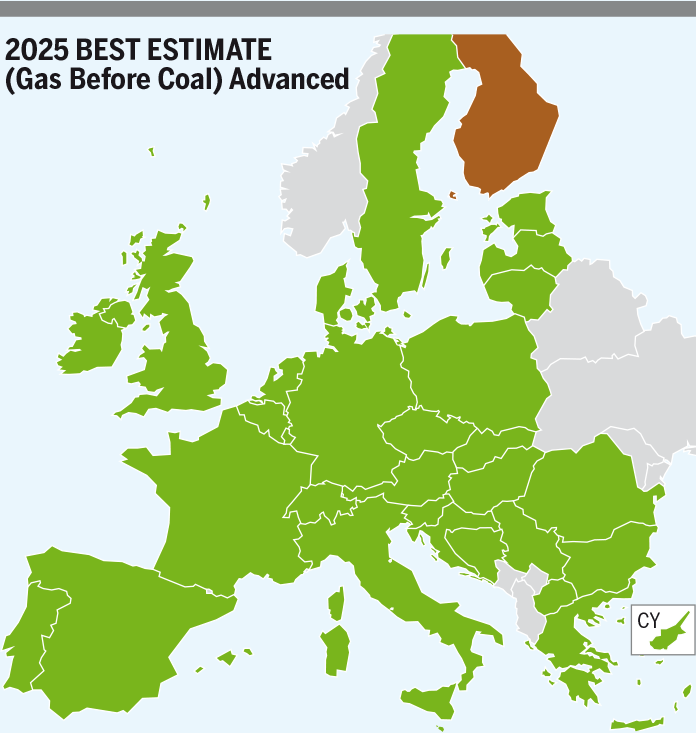
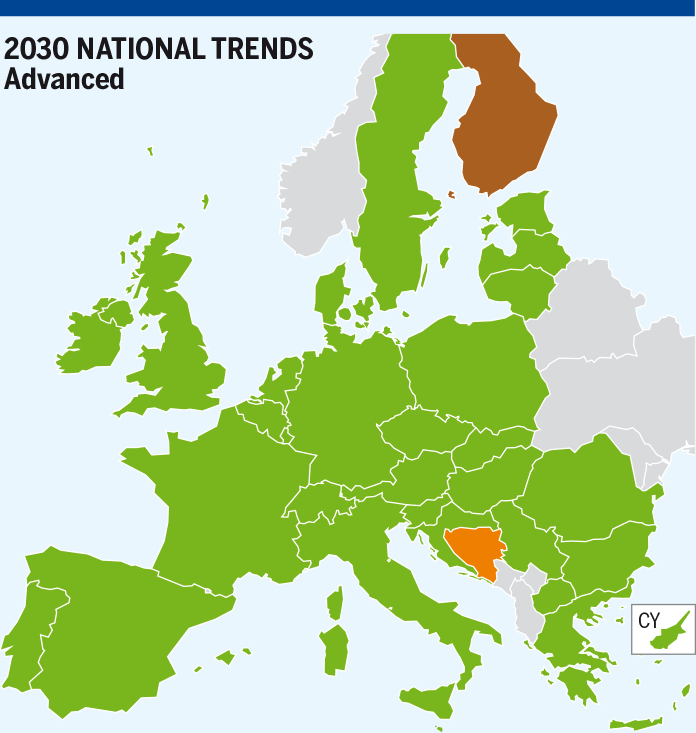
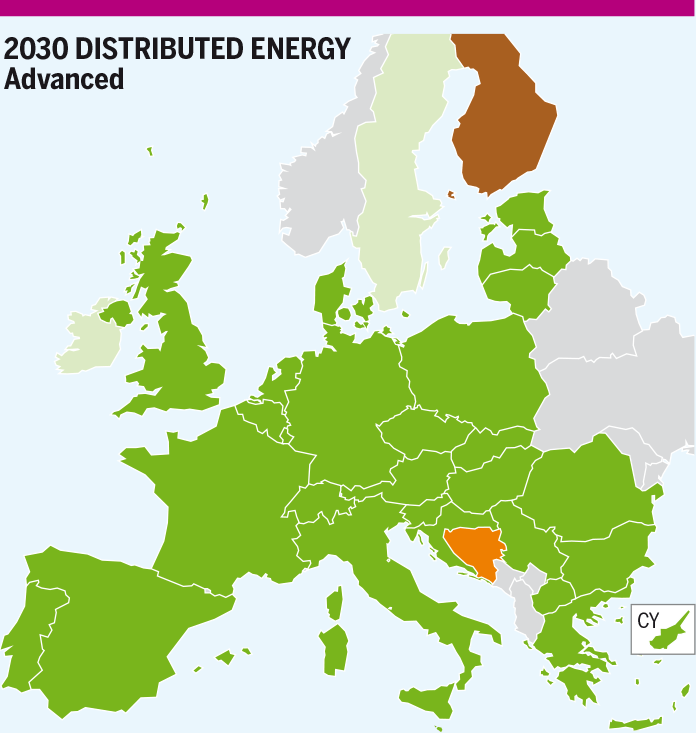
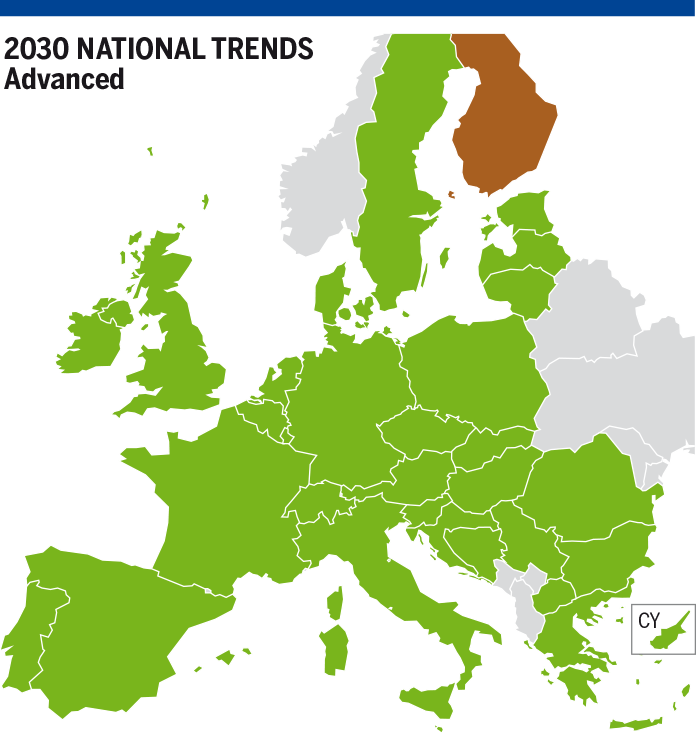
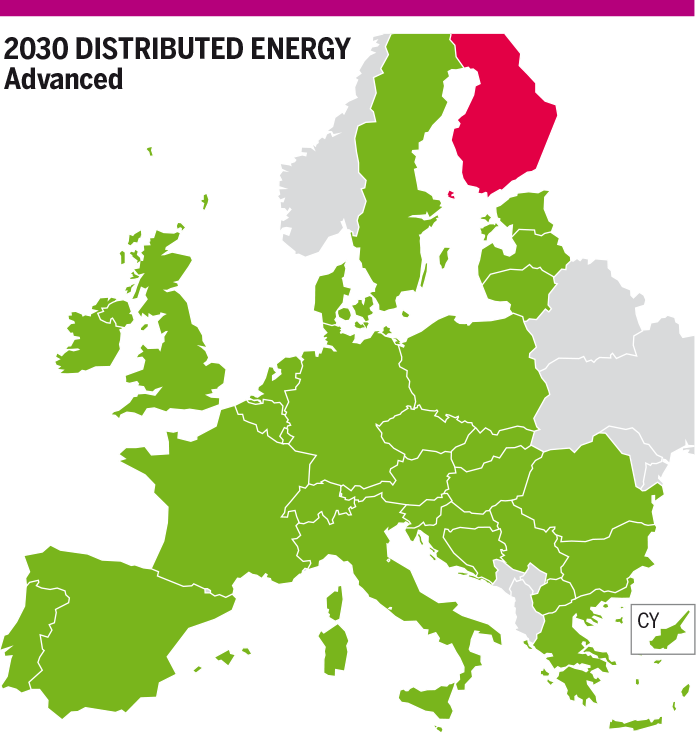
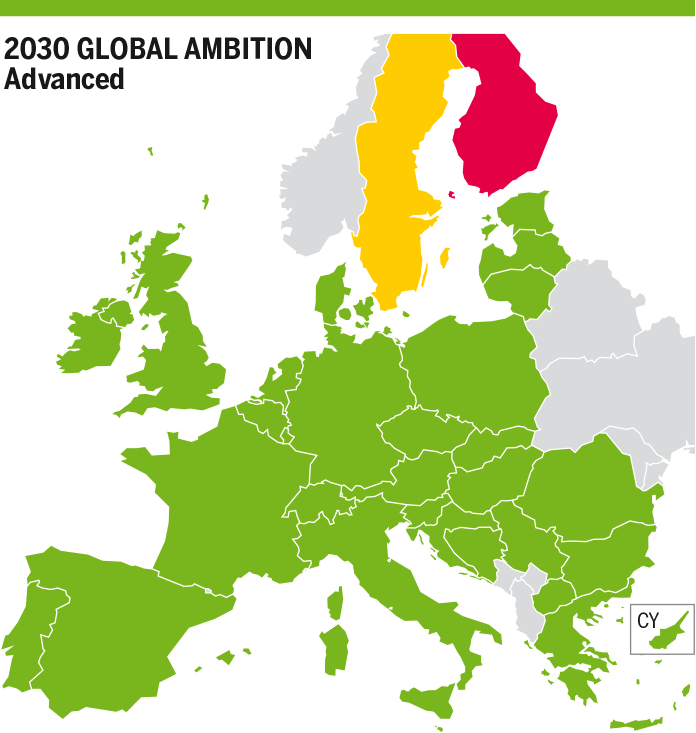
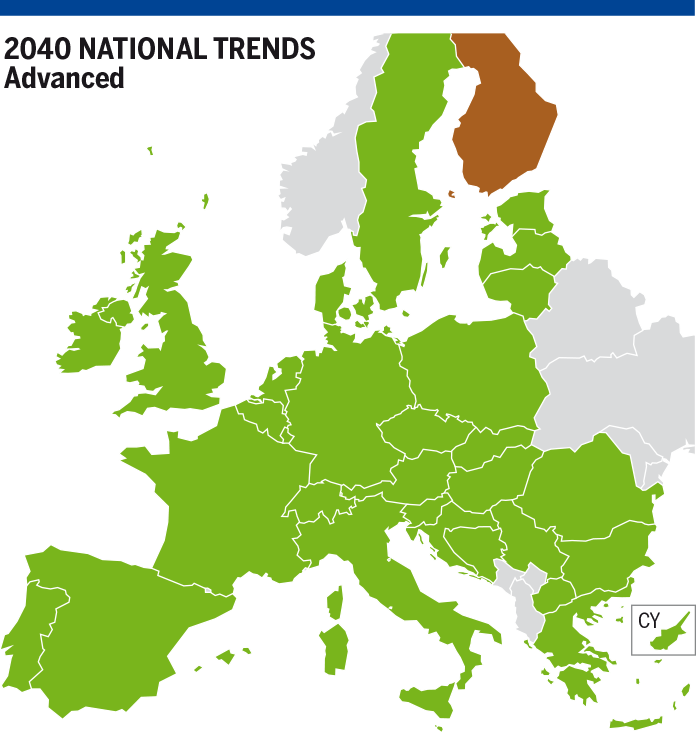
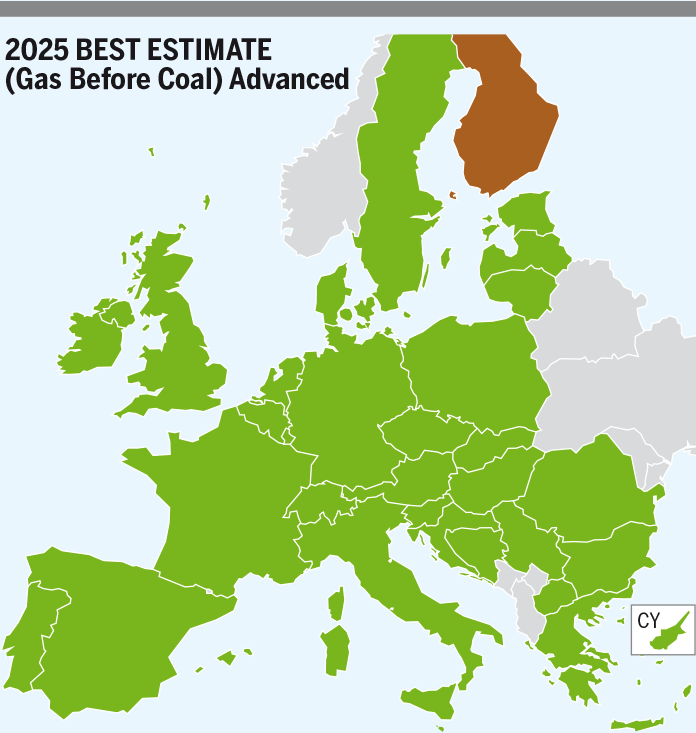
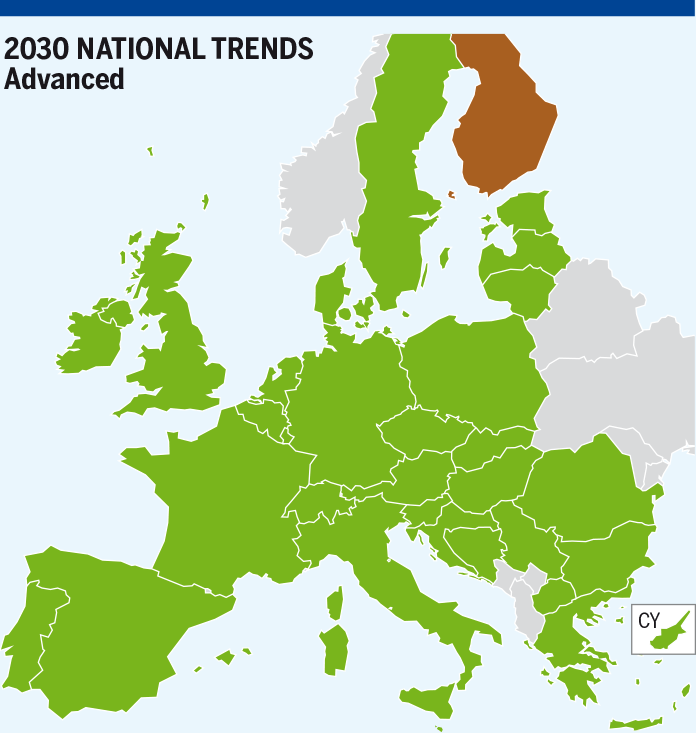
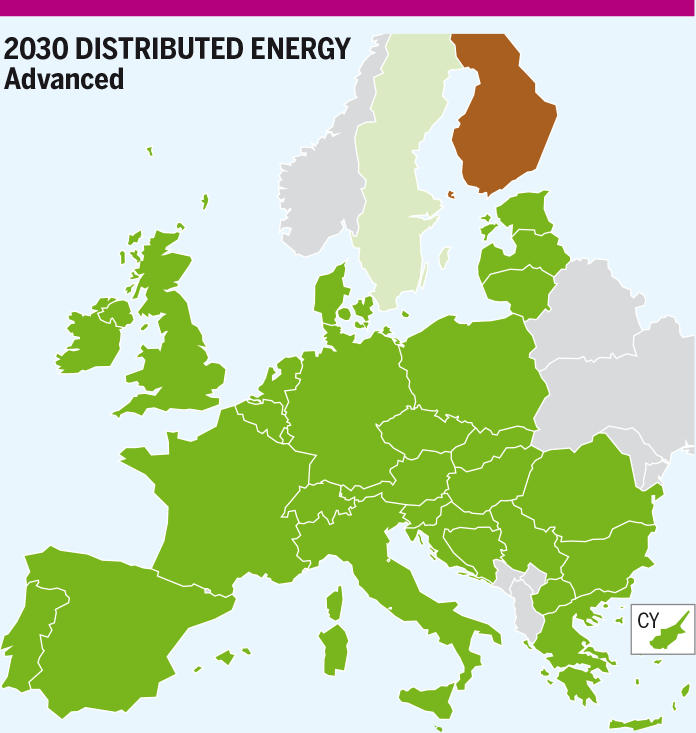
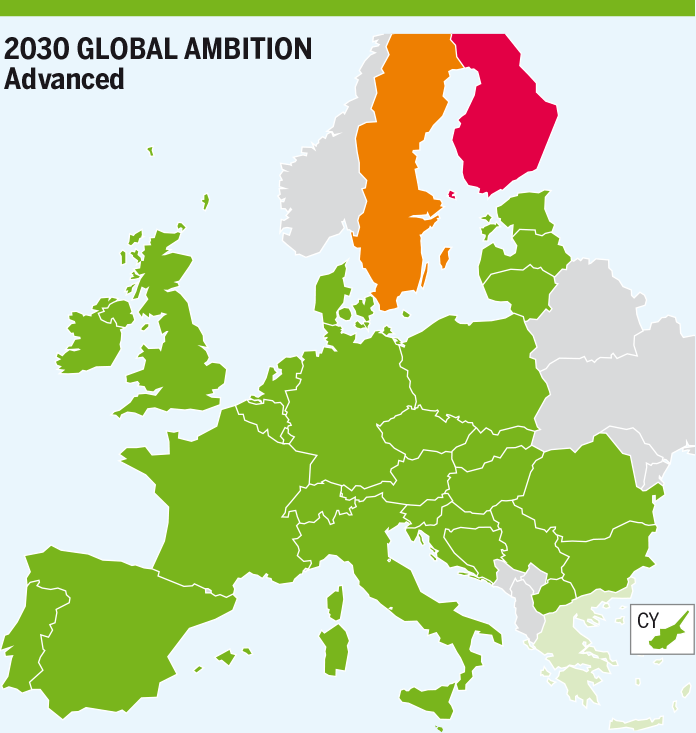
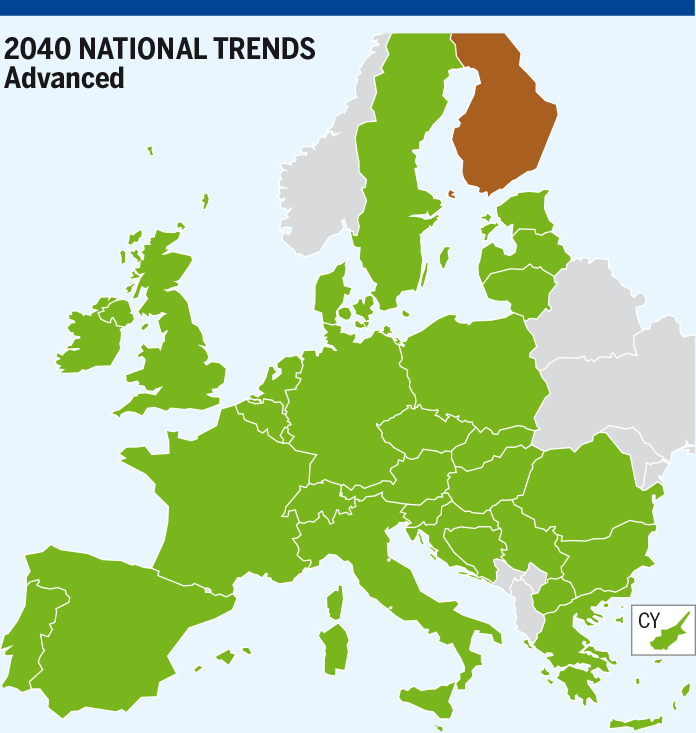
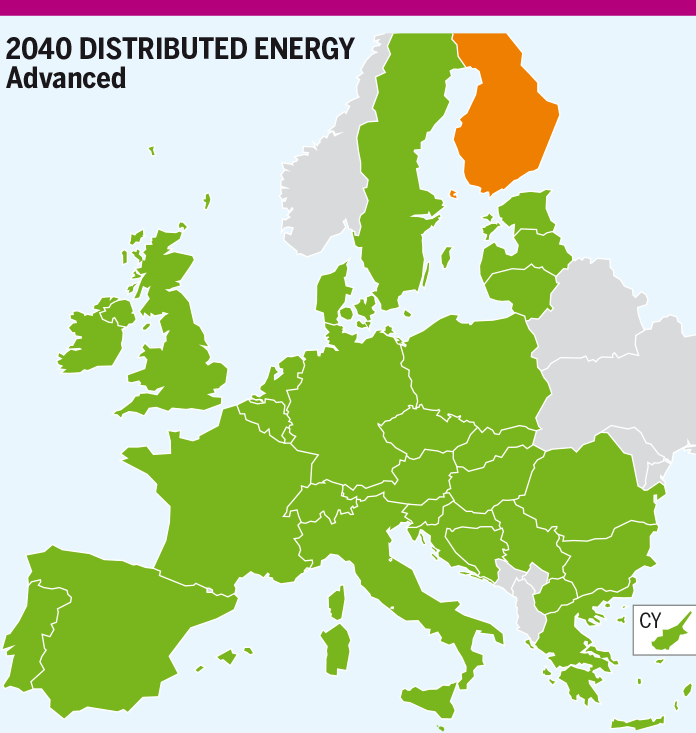
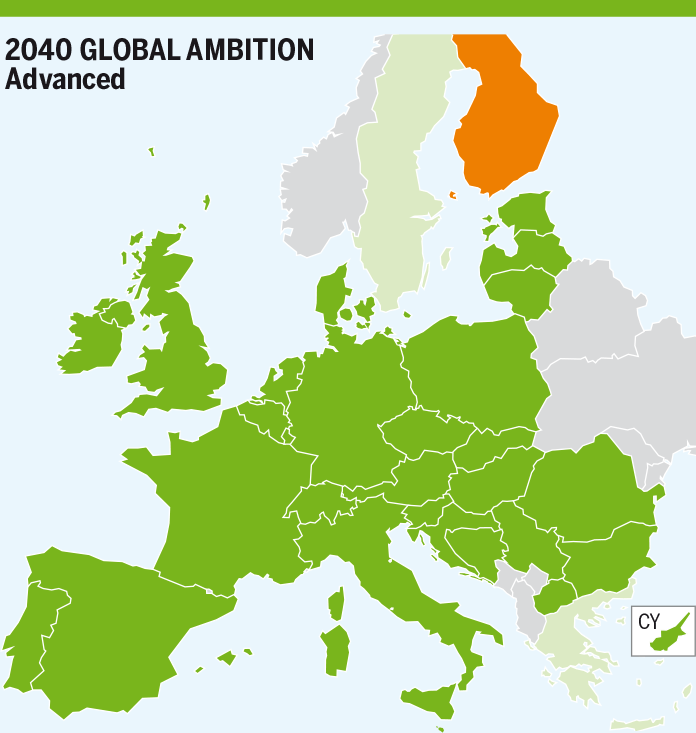
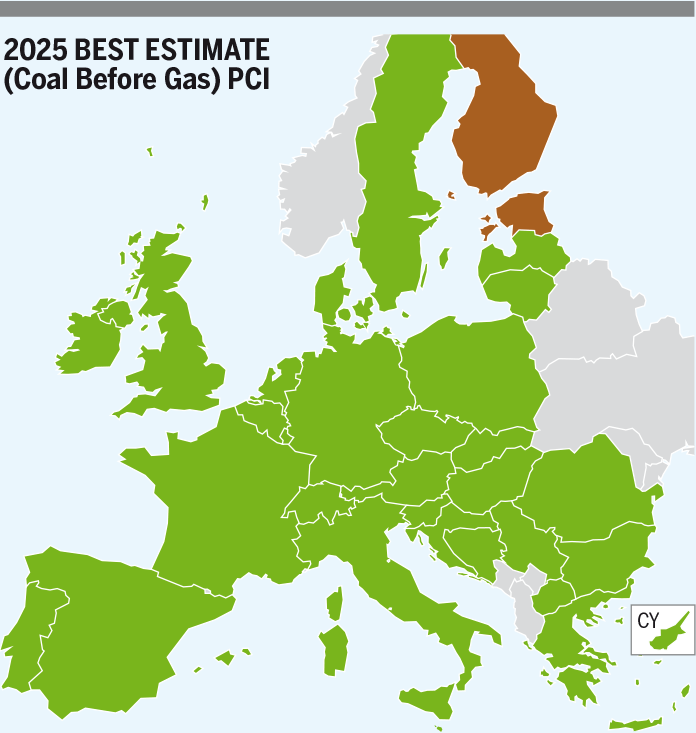
Simulation results show that advanced-status projects provide an infrastructure reinforcement in the Baltic countries required to cope with high demand situations, nevertheless, Finland is still exposed to a risk of demand curtailment in most of the scenarios. Figure 4.82 shows the Advanced infrastructure level results described below.
2025
Coal Before Gas/Gas Before Coal
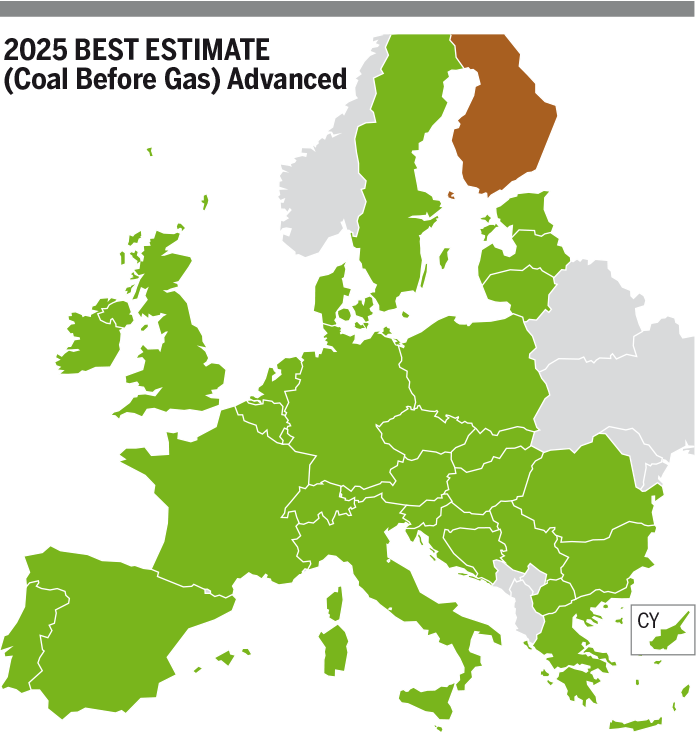
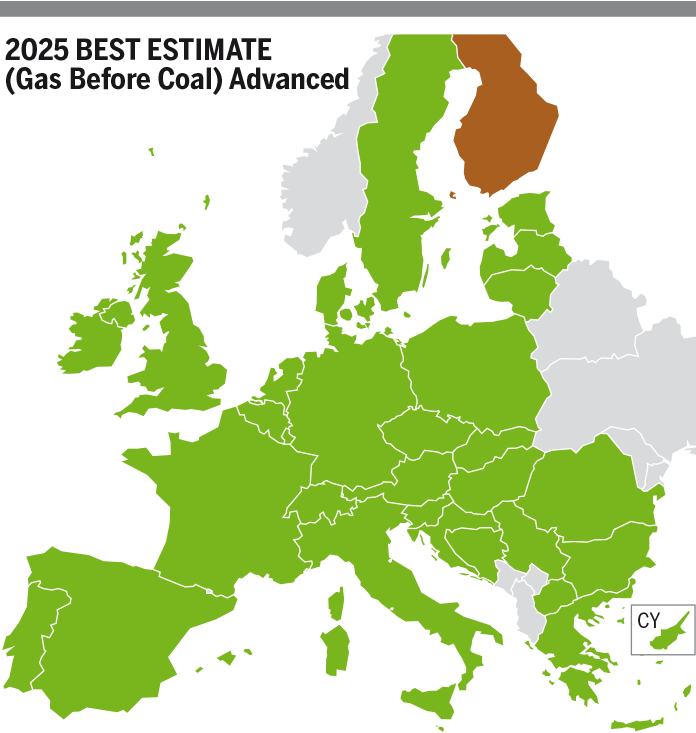
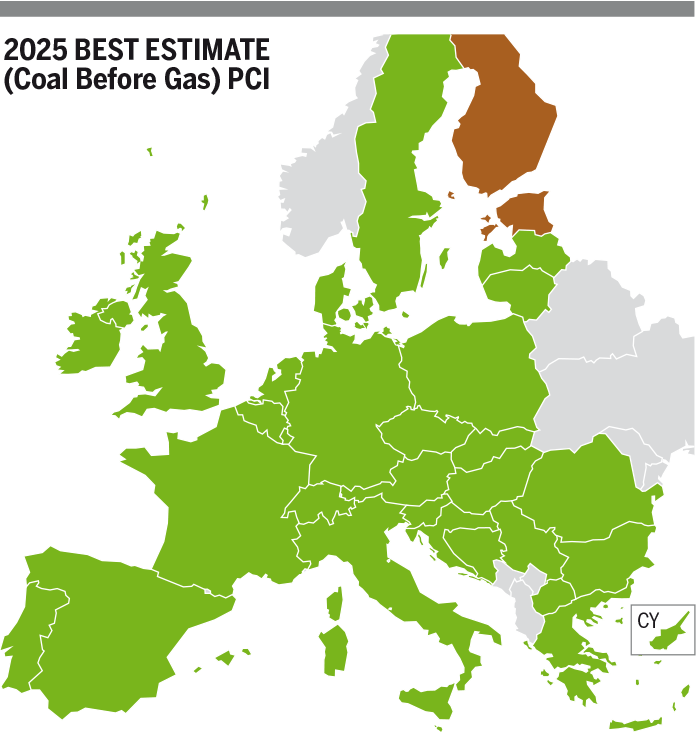
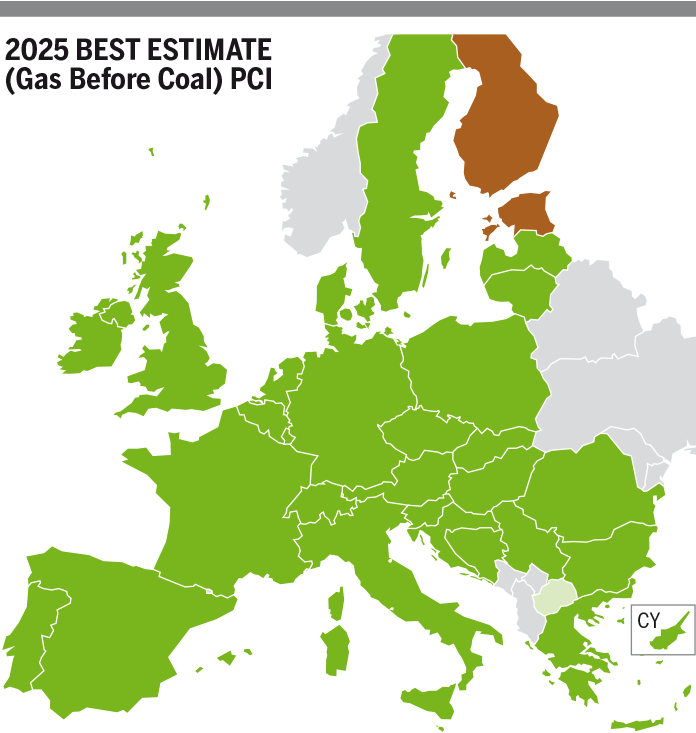
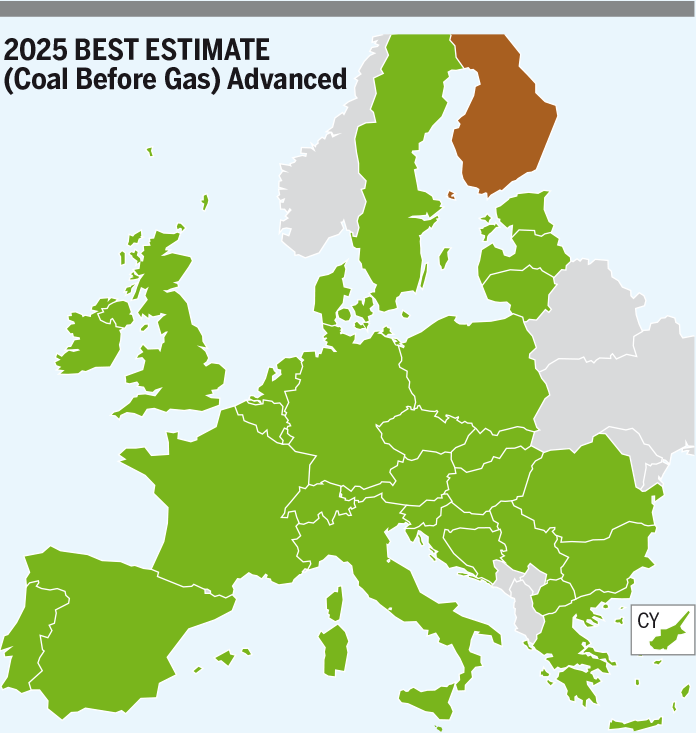
Simulation results show that advanced-status projects fully mitigate the risk of demand curtailment in Estonia from 2025 onwards thanks to the commissioning of one LNG terminal project in 2022. Finland is still exposed, but to a lesser extent, to a risk demand curtailment (63 – 67 % in Coal Before Gas and Gas Before Coal respectively), being the cooperation between Estonia-Finland limited by the Balticconnector capacity showing infrastructure limitation in the area.
2030-2040
National Trends
Results show the same situation as for 2025 scenarios. Estonia fully mitigates its risk of demand curtailment thanks to the commissioning of one LNG terminal project in 2025. The cooperation between Estonia-Finland is limited by the Balticconnector capacity, making Finland still face a risk of demand curtailment but to a lesser extent and showing infrastructure limitation in the area.
COP 21 scenarios
Distributed Energy and
Global Ambition
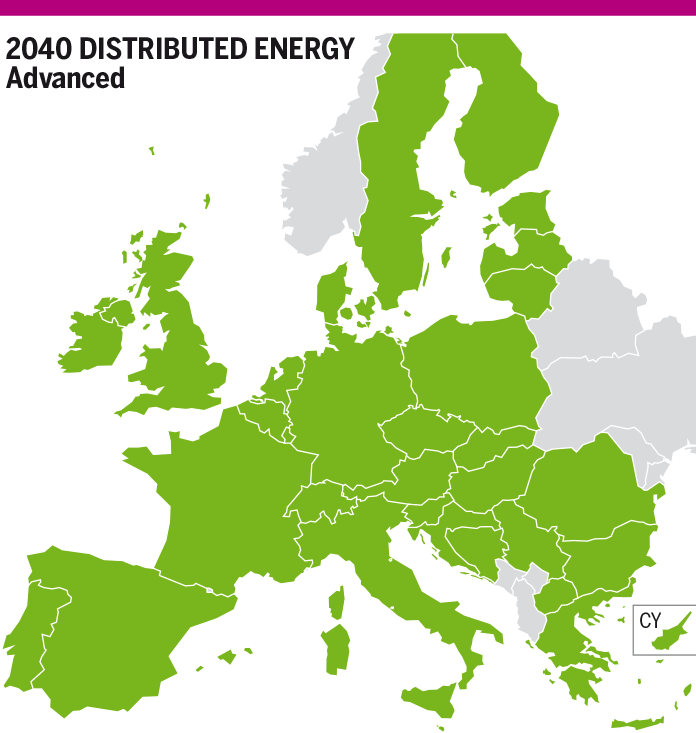
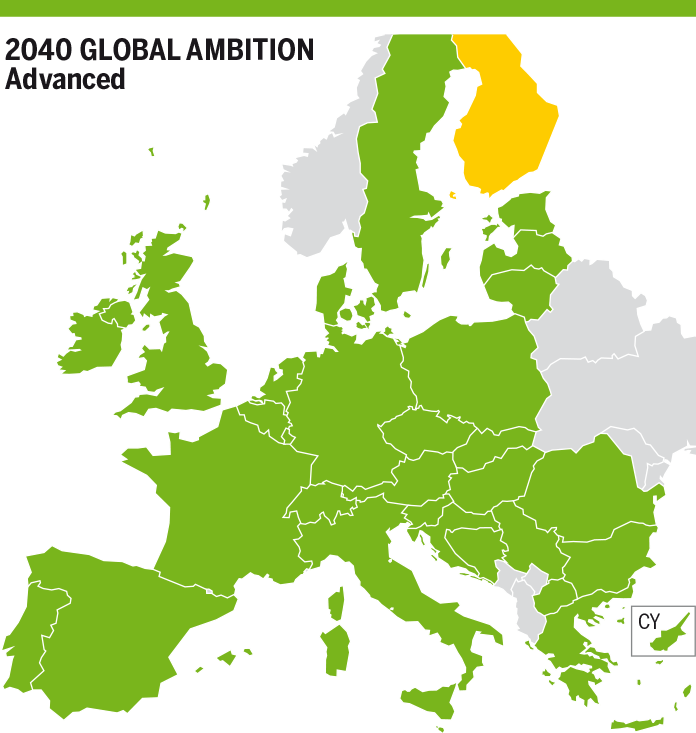
As for National Trends and 2025 scenarios, Estonia fully mitigates its risk of demand curtailment in Distributed Energy 2030 and Global Ambition 2030/2040 thanks to the commissioning of one LNG terminal project in 2025. Additionally, Finland reduces its risk of demand curtailment in Distributed Energy 2030 and Global Ambition 2030/2040 being the capacity between both countries fully used, showing infrastructure limitation in the area.
Lithuania fully mitigates its risk of demand curtailment in Distributed Energy 2030 and Global Ambition 2030 – 2040 thanks to the commissioning of advanced-status projects in the area.
Moreover, Latvia fully mitigates its risk of demand curtailment in Distributed Energy and Global Ambition 2030 thanks to the reduction of the cooperation between Latvia-Estonia driven by the commissioning of advanced-status project in the area.

Figure 4.82: Advanced infrastructure level: Baltics States and Finland transit disruption under peak day situation.
PCI Infrastructure level
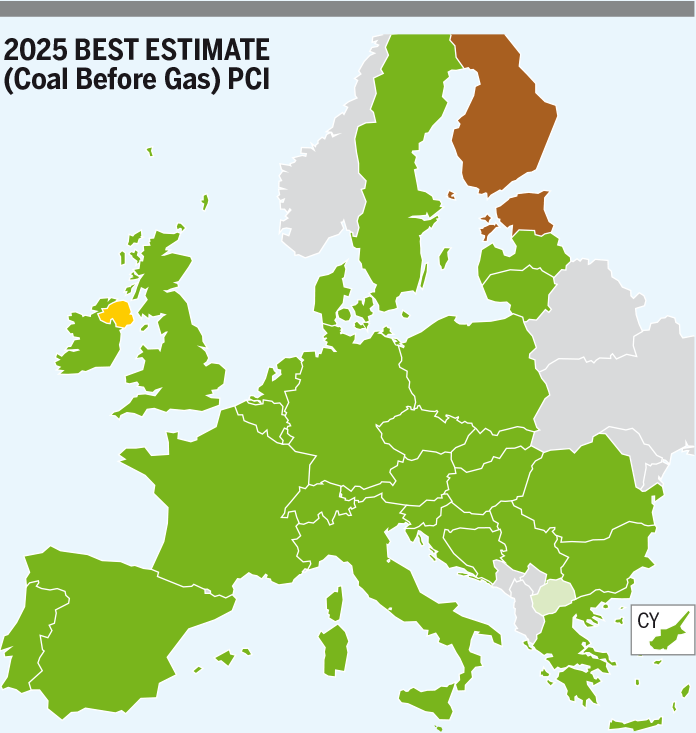
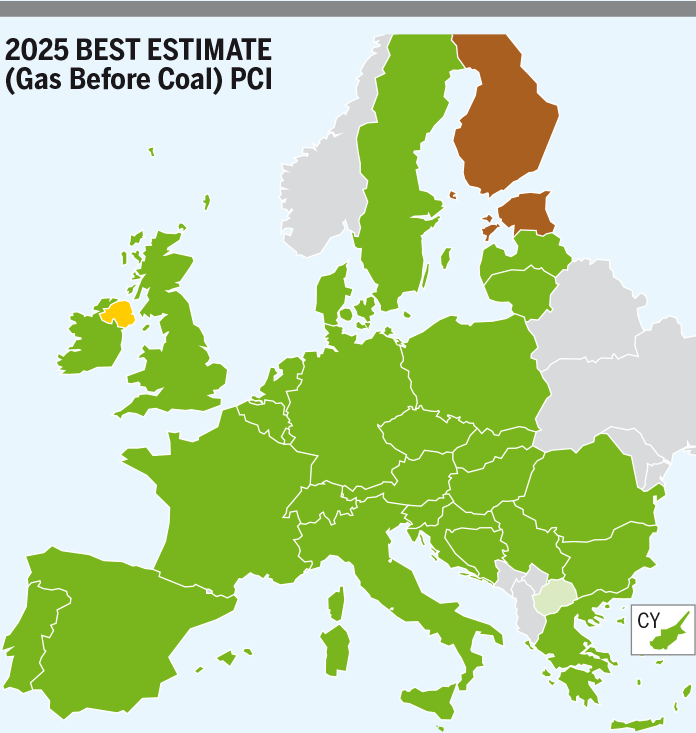
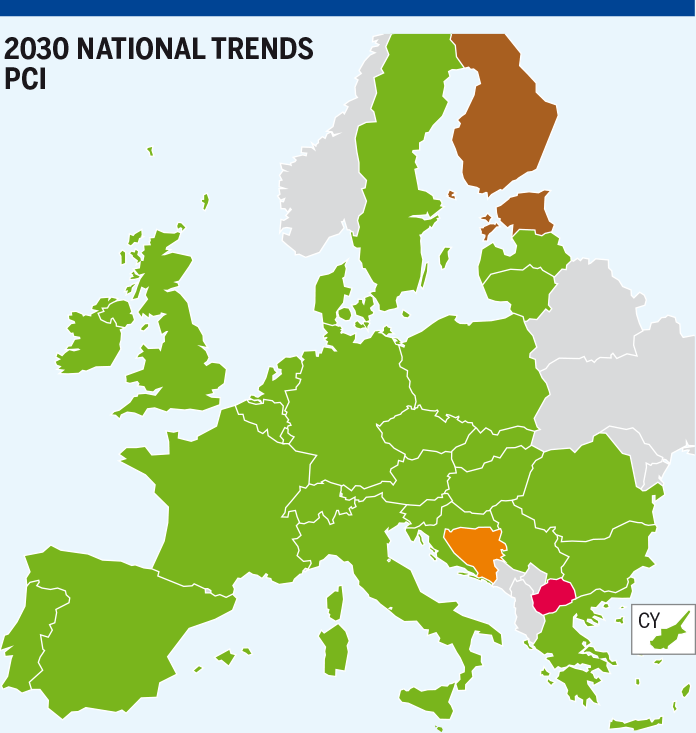
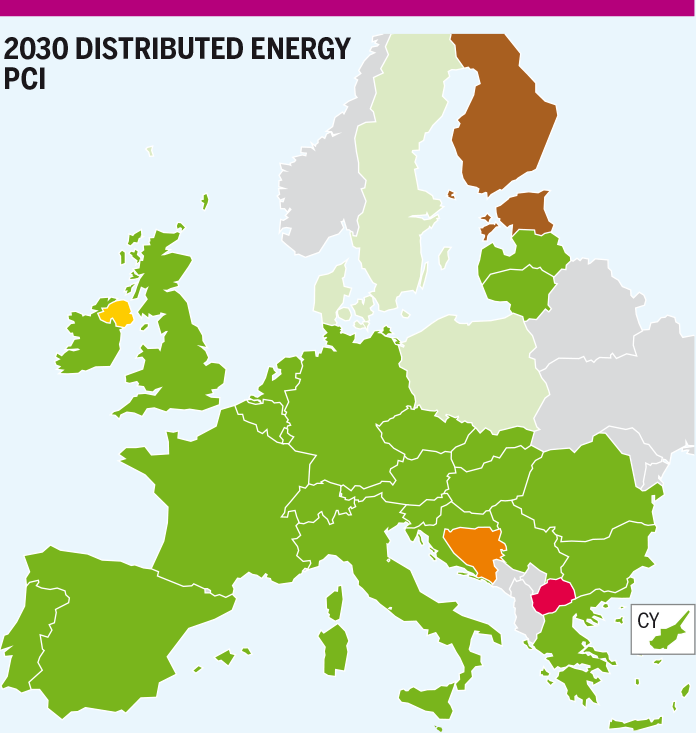
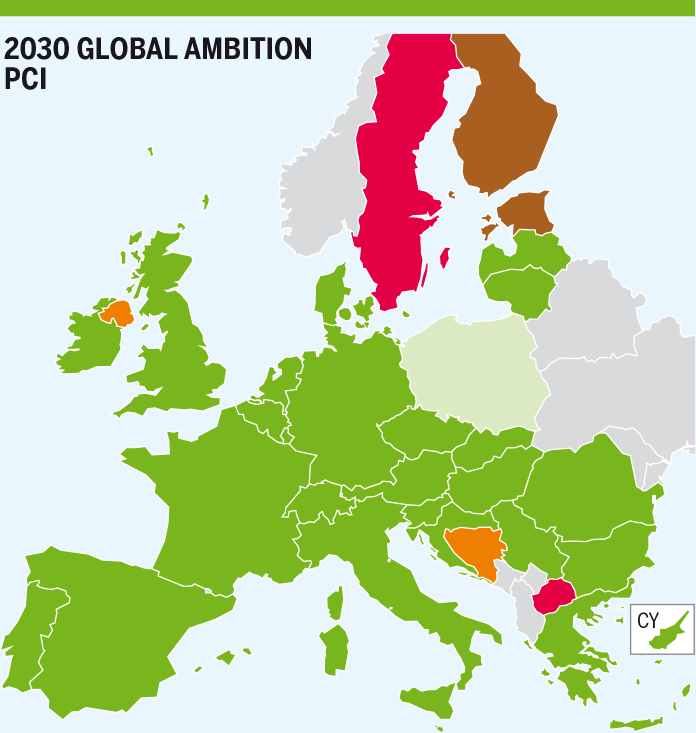
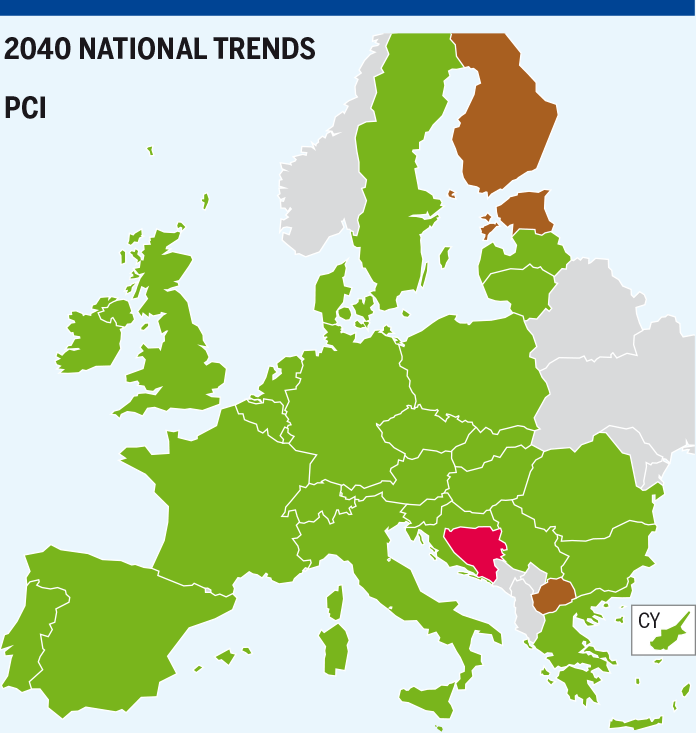
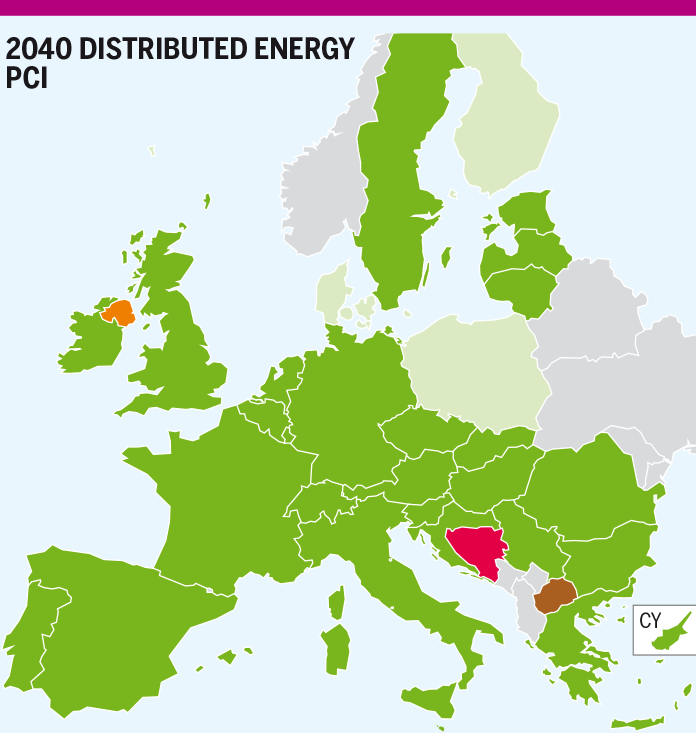
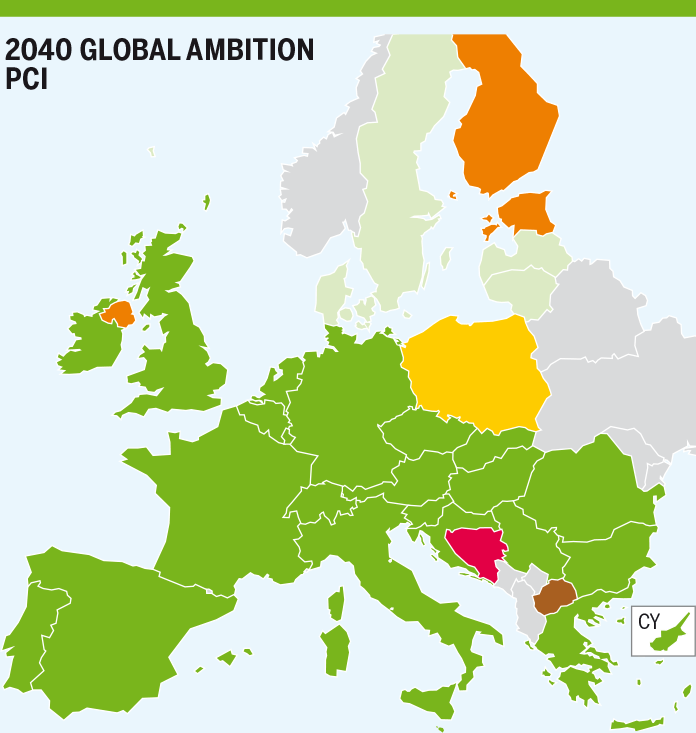
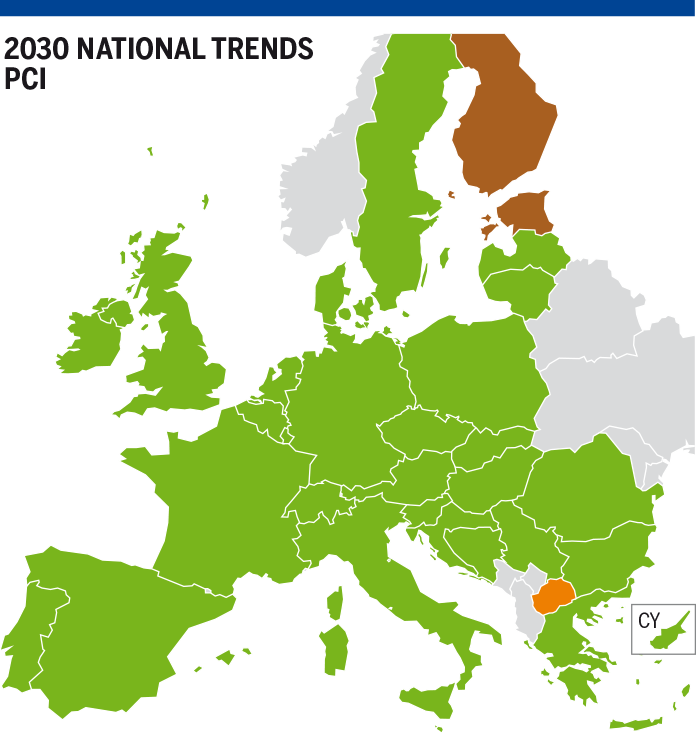
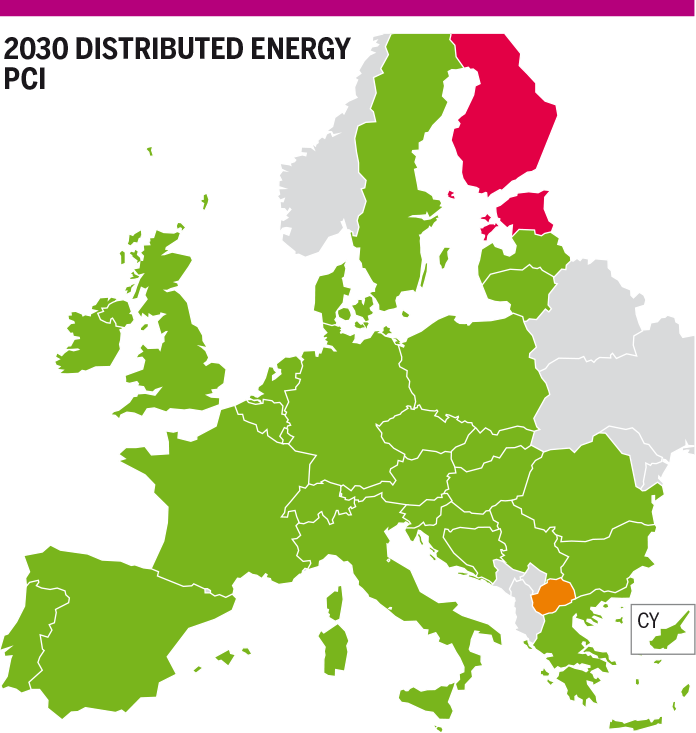
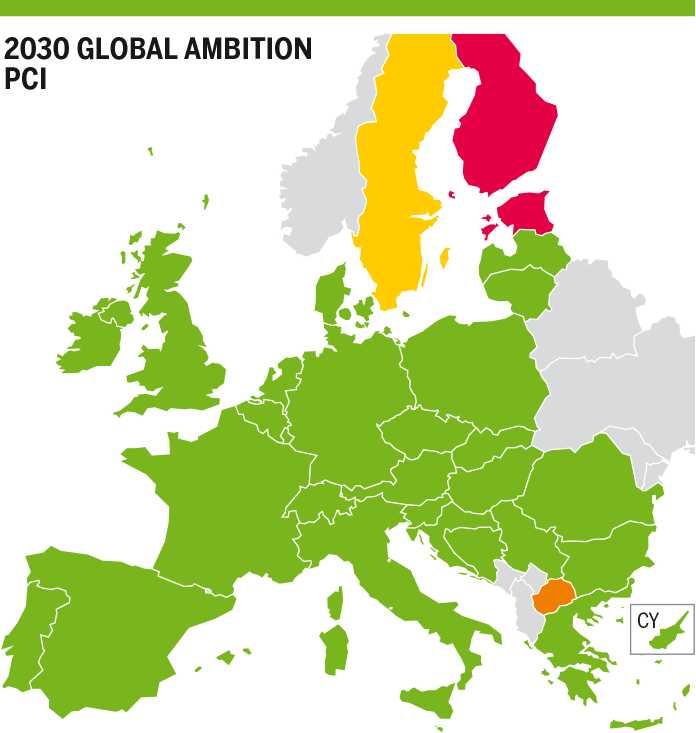
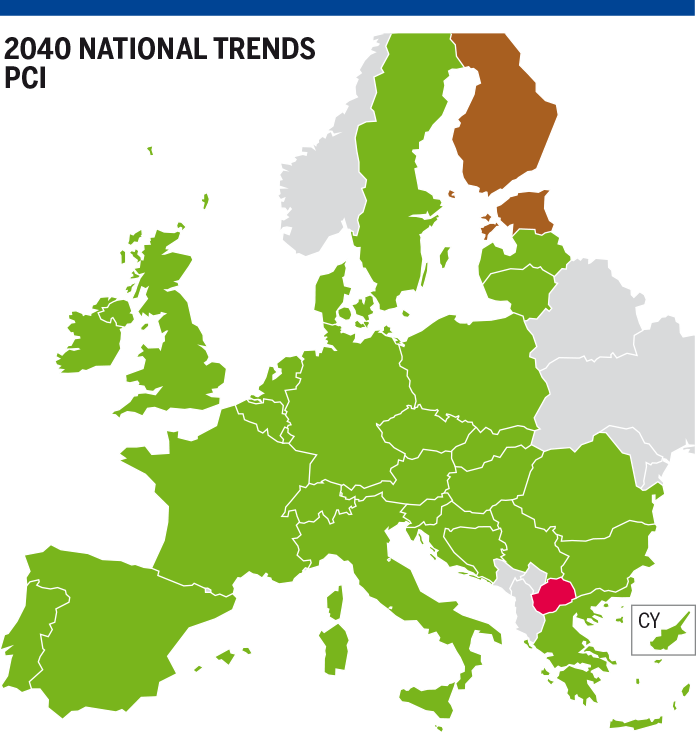
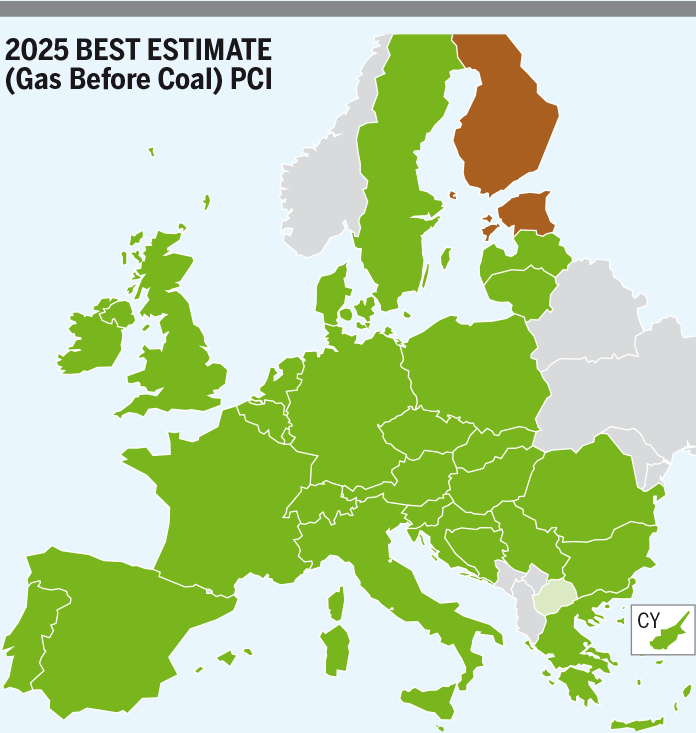
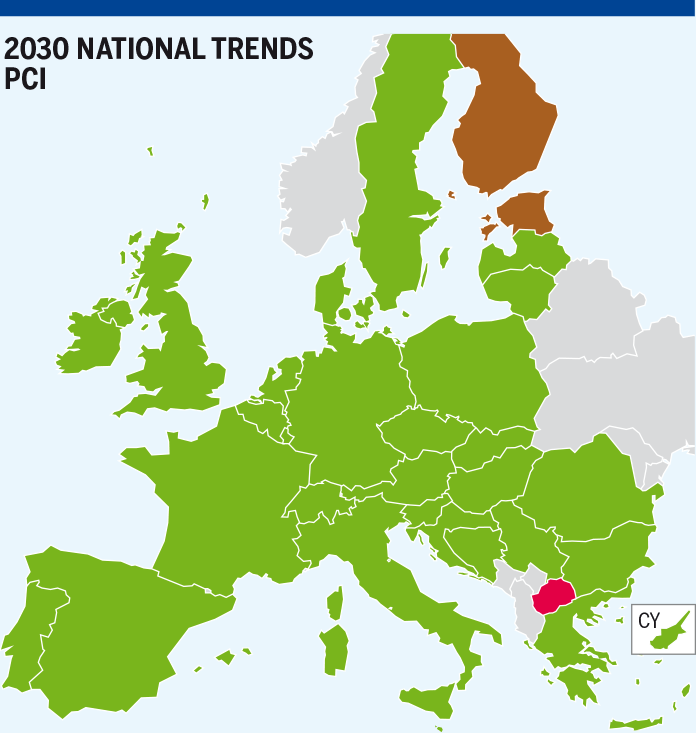
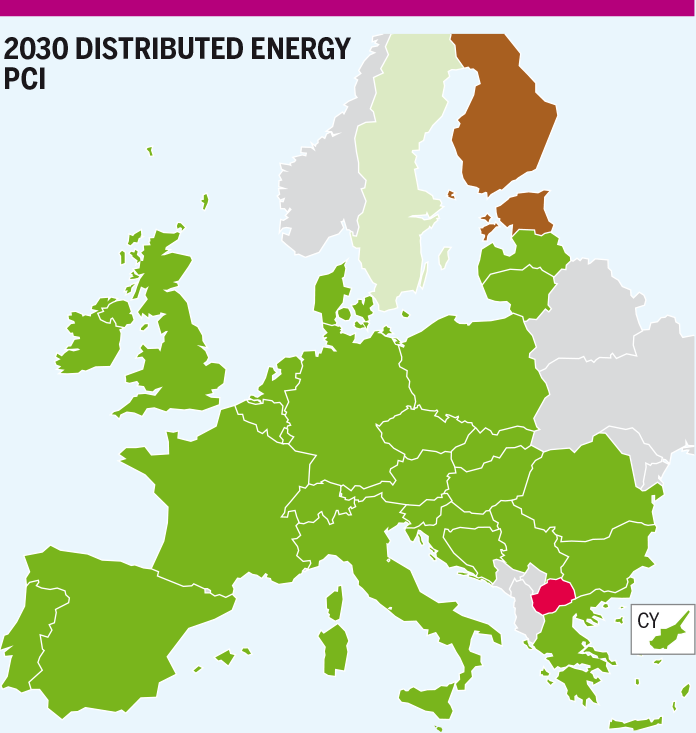
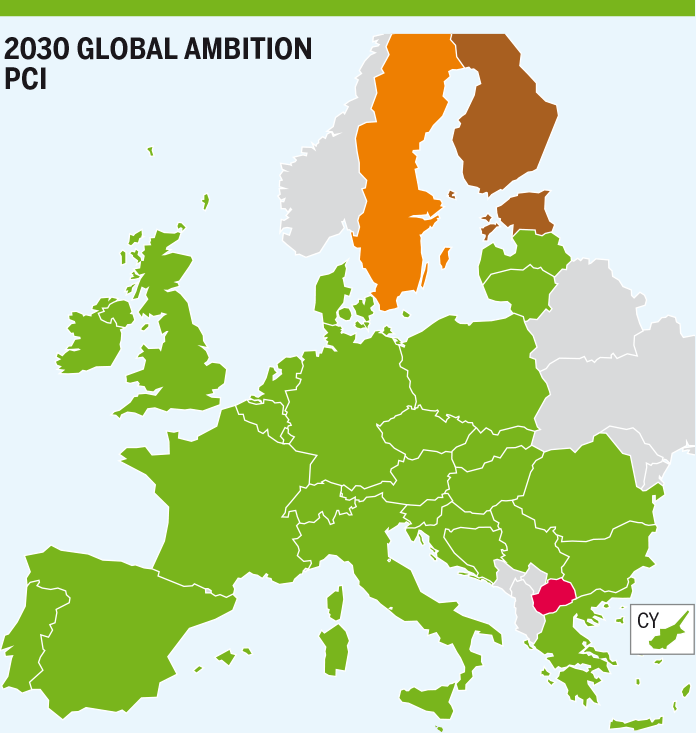
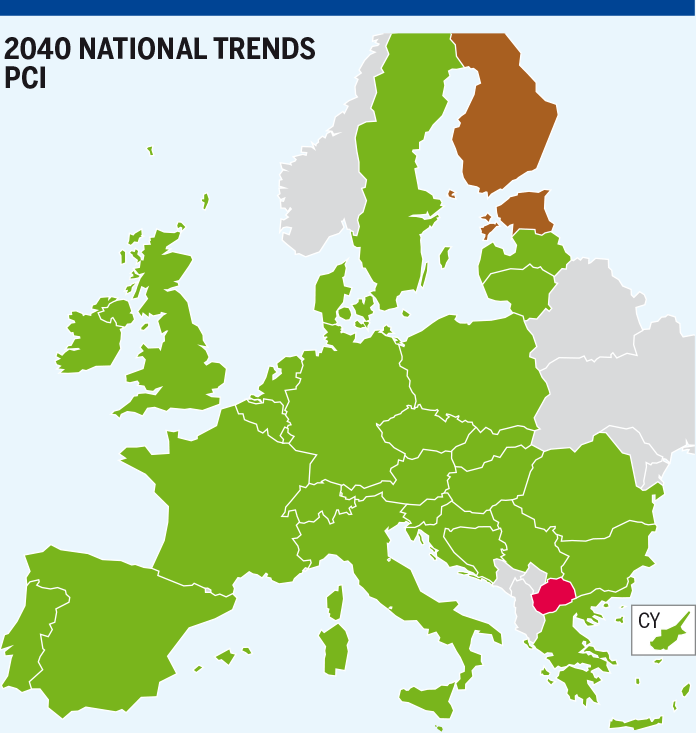
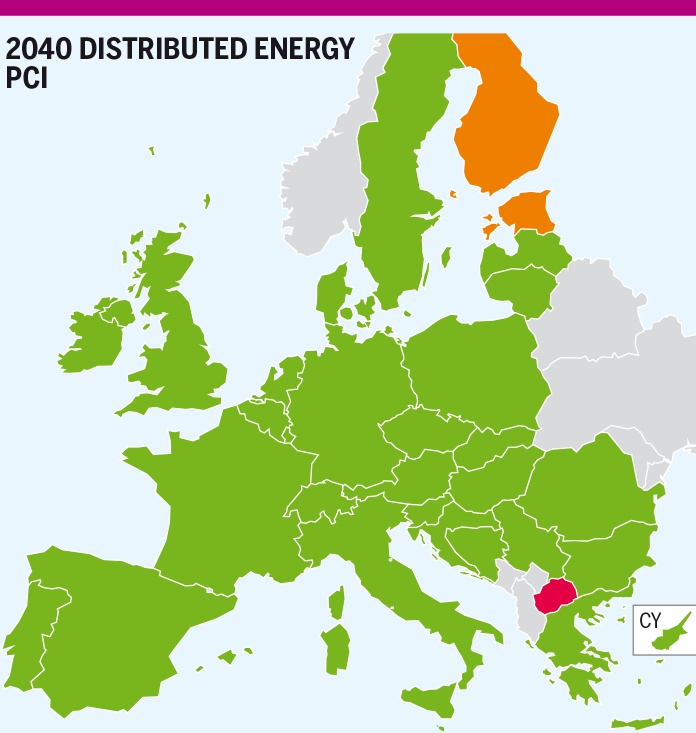
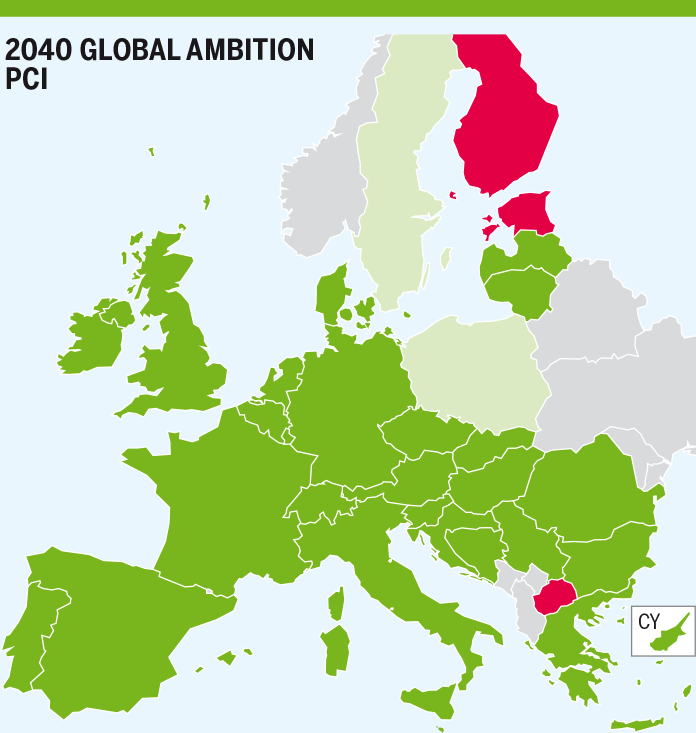
This infrastructure level assesses the different scenarios under peak day demand together with Baltics States and Finland transit disruption against the current European gas system infrastructure complemented with FID projects (Low infrastructure level) and all projects included in the latest 4th PCI list showing the benefits stemming from the implementation of the latest PCI list. Figure 4.83 shows the evolution of the PCI infrastructure level.
2025
Coal Before Gas/Gas Before Coal
Results are in line with Low infrastructure level assessment. Finland and Estonia are exposed to the same extent of risk of demand curtailment as in Low infrastructure level. There are no PCI projects improving the situation in the area.
2030-2040
National Trends
As for 2025 scenarios, the results are in line with Low infrastructure level assessment. Finland and Estonia are exposed to the same extent of risk of demand curtailment as in Low infrastructure level. There are no PCI projects improving the situation in the area.
COP 21 scenarios
Distributed Energy and
Global Ambition
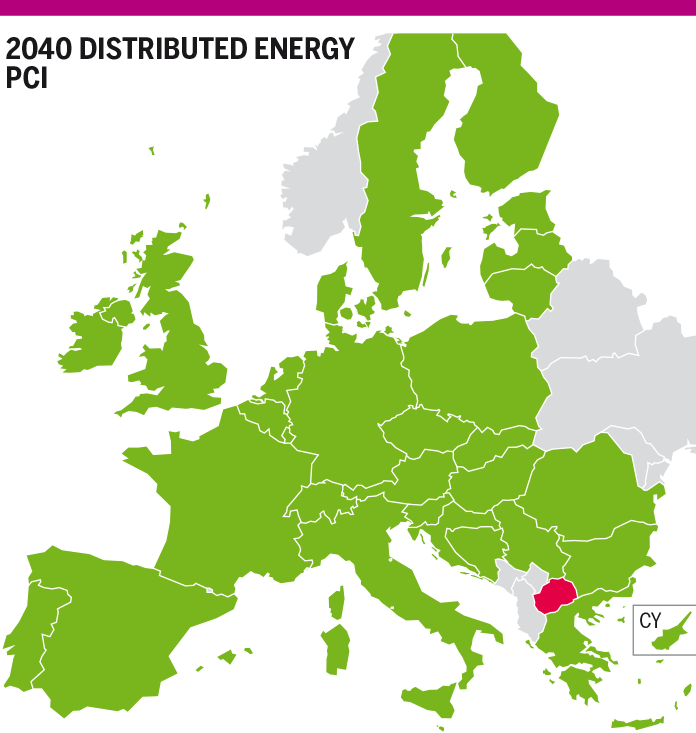
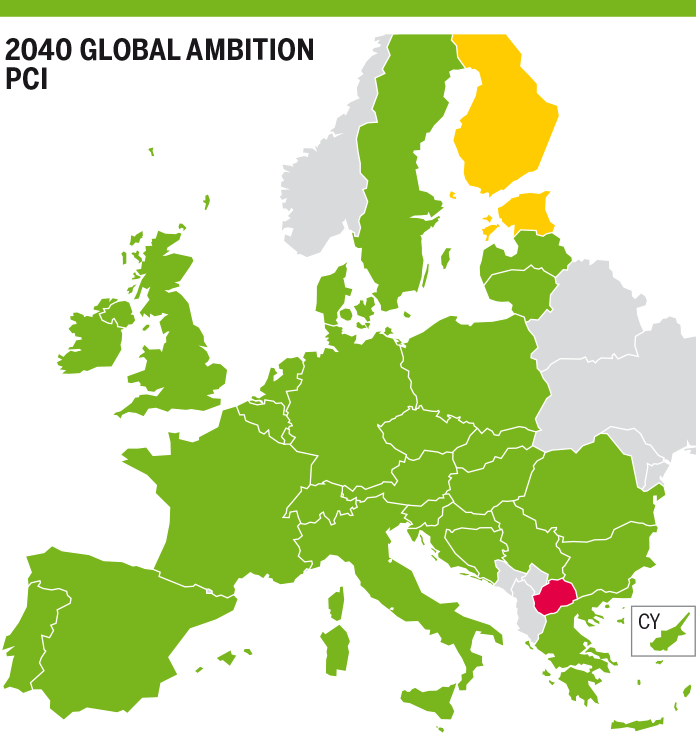
The results for Finland and Estonia are in line with Low infrastructure level assessment. Finland and Estonia are exposed to the same extent of risk of demand curtailment as in Low infrastructure level showing that there are no PCI projects investments in the area improving the situation1.
Nevertheless, Lithuania and Latvia fully mitigate their risk of demand curtailment thanks to the commissioning of projects included in the 4th PCI list in neighbouring countries.
1 Differing from the climatic stress conditions assessment without transit disruption (section 4.1 of this Assessment Report) Denmark and Sweden are not exposed to a risk of demand curtailment in Global Ambition 2040 scenario mainly driven by the lower cooperation between Denmark and Poland which increases the cooperation between Denmark and Sweden. Note that transit disruption cases simulations are based on the Regional Assessment, in this regard, countries outside the regional zone are not asked to cooperate further.

Figure 4.83: PCI infrastructure level: Baltics States and Finland transit disruption under peak day situation.
4.2.3.2 2-week cold spell
Existing Infrastructure level
Simulation results show some needs of infrastructure in the Baltic states and Finland area. Figure 4.85 shows the evolution of the Existing infrastructure level described below:
2025
Coal Before Gas/Gas Before Coal
Coal Before Gas and Gas Before Coal scenarios, results show that Finland is exposed to a high risk of demand curtailment (83 – 84 % in Coal Before Gas and Gas Before Coal scenarios respectively), being the Balticconnector capacity fully used and no indigenous production in Finland. Estonia has a remaining flexibility below 15 % (11 – 10 % in Coal Before Gas and Gas Before Coal scenarios respectively).
2030-2040
National Trends
Simulation results show a high risk of demand curtailment in Finland mainly driven by an infrastructure limitation, being the capacity from Estonia to Finland fully used, combined with a low indigenous production in Finland coming from biomethane. Estonia has a remaining flexibility below 15 % (13 – 14 % in 2030 and 2040 respectively).
COP 21 scenarios
Distributed Energy and
Global Ambition
Estonia-Finland cooperation is limited by the already available capacity of Balticonnector pipeline, first phase, being fully used. Finland faces a high risk of demand curtailment in Distributed Energy 2030 and Global Ambition 2030/2040.
n 2040, Finland is not exposed to a risk of demand curtailment in Distributed Energy thanks to a remarkable increase of the indigenous production coming from renewables (biomethane and power to gas) and a decrease of its demand. Moreover, in Global Ambition scenario, the lower risk of demand curtailment in Finland (ca. 38 %) compared to 2030 (ca. 72 %) is mainly driven by the increase of the indigenous production in the country coming from renewables (biomethane and power to gas).
Estonia’s remaining flexibility is above 15 % thanks to a lower demand combined with higher indigenous production coming from renewables (biomethane and power to gas). See Figure 4.84.
Figure 4.84: 2-week cold spell demand and production in Finland in COP 21 scenarios in GWh/d.

Figure 4.85: Existing infrastructure level: Baltics States and Finland transit disruption under 2-week cold sell situation.
Low Infrastructure level
Simulation results show that the commissioning of some FID projects increases the cooperation between neighbouring countries in the Baltic states and Finland area. Figure 4.86 shows the Low Infrastructure level results described below.
2025
Coal Before Gas/Gas Before Coal
Simulation results show that Finland is still exposed to a risk of demand curtailment in both scenarios. The risk of demand curtailment in Finland decreases, from 85 – 83 % (Coal before Gas and Gas before Coal respectively) in Existing infrastructure level to 67 – 69 %(Coal before Gas and Gas before Coal respectively) in Low infrastructure level, thanks to the commissioning of the second capacity increment of the FID Project Balticconnector, which allows more gas to flow from Estonia to Finland.
While the capacity increment in Balticconnector increases the cooperation between Estonia and Finland, Estonia shares Finland’s risk of demand curtailment up to the same extend 66 – 68 % (Coal before Gas and Gas before Coal respectively).
Additionally, there is infrastructure limitation in the area, restricting the flow from Latvia to Estonia, combined with no indigenous production in Finland and very low in Estonia coming from biomethane production.
2030 – 2040
National Trends
As for 2025 scenarios, the increment capacity in Balticconnector increases the cooperation between Estonia-Finland. As a result, Finland decreases its risk of demand curtailment while Estonia shares Finland’s risk of demand curtailment up to the same extend.
There is infrastructure limitation, restricting the flow from Latvia to Estonia, combined with low indigenous production in Finland and Estonia coming from biomethane.
COP 21 scenarios
Distributed Energy and
Global Ambition
In 2030, as for National Trends and 2025 scenarios, the increment capacity in Balticconnector increases the cooperation between Estonia-Finland. As a result, Finland decreases its risk of demand curtailment while Estonia shares Finland’s risk of demand curtailment up to the same extent.
In 2040, the situation improves thanks to the reduction of the demand and increase of the indigenous production in Finland and Estonia in Distributed Energy and Global Ambition scenarios. In Global Ambition 2040 Finland and Estonia reduce their risk of demand curtailment from 54 % in 2030 (both countries) to 10 – 8 % in 2040 (Finland and Estonia respectively) thanks to the commissioning of FID projects in the Baltic area. In Distributed Energy 2040, Finland and Estonia fully mitigate their risk of demand curtailment.

Figure 4.86: Low infrastructure level: Baltics States and Finland transit disruption under 2-week cold sell situation.
Advanced Infrastructure level
Simulation results show that advanced-status projects provide an infrastructure reinforcement in the Baltic countries required to cope with high demand situations. Figure 4.87 shows the Advanced infrastructure level results described below.
2025
Coal Before Gas/Gas Before Coal
Results show that advanced-status projects fully mitigate the risk of demand curtailment in Estonia from 2025 onwards with the commissioning of one LNG terminal project in 2022. Finland is still exposed, to a lesser extent (56 – 60 % in Coal Before Gas and Gas Before Coal respectively), to a risk of demand curtailment, being the capacity between both countries fully used.
2030-2040
National Trends
Simulation results are in line with 2025 scenarios. Estonia fully mitigates its risk of demand curtailment thanks to the commissioning of one LNG terminal project in 2025.
The cooperation between Estonia-Finland is limited by the capacity of the interconnection, allowing Finland to reduce its risk of demand curtailment from 67 % in Low infrastructure level to 57 % in the Advanced infrastructure level.
COP 21 scenarios
Distributed Energy and
Global Ambition
Simulation results show that Estonia fully mitigates its risk of demand curtailment in 2030 for both scenarios and Global Ambition 2040 thanks to the commissioning of one LNG terminal project in 2025.
Finland slightly reduces its risk of demand curtailment in 2030 for both scenarios and Global Ambition 2040, nevertheless, the cooperation between Estonia-Finland is limited by the capacity of the interconnection.

Figure 4.87: Advanced infrastructure level: Baltics States and Finland transit disruption under 2-week cold sell situation.
PCI Infrastructure level
This infrastructure level assesses the different scenarios under 2-week cold spell demand together with Baltics States and Finland transit disruption against the current European gas system infrastructure complemented with FID projects (Low infrastructure level) and all projects included in the latest 4th PCI list showing the benefits stemming from the implementation of the latest PCI list. Results are in line with Low infrastructure level assessment. Figure 4.88 shows the PCI infrastructure level results.

Figure 4.88: PCI infrastructure level: Baltics States and Finland transit disruption under 2-week cold sell situation.
4.2.3.3 2-week Dunkelflaute
Existing Infrastructure level
Simulation results show similar behaviour than for a 2-week cold spell. Figure 4.90 shows the evolution of the Existing infrastructure level described below.
2025
Coal Before Gas/Gas Before Coal
Simulation results show that Finland is exposed to demand curtailment (84 – 85 % in Coal Before Gas and Gas Before Coal scenarios respectively) due to infrastructure limitation, being the Balticconnector capacity fully used, combined with the absence of indigenous production in Finland. Regarding Estonia, the remaining flexibility is below 15 %.
2030-2040
National Trends
Finland is exposed to a high risk of demand curtailment driven by infrastructure limitation in the area, being the Balticconnector capacity fully used, and very low indigenous production in the country coming from biomethane.
Furthermore, Estonia is exposed to a limited risk of demand curtailment in 2030 driven by an increase of its gas demand for power generation, being the gas system a backup of the intermittent renewable power generation coming from wind and solar, together with infrastructure limitation from Latvia to Estonia. See Figure 4.89.
COP 21 scenarios
Distributed Energy and
Global Ambition
Simulation results show that in case of a 2-week Dunkelflaute demand case, Finland faces a higher risk of demand curtailment, compare to 2-week cold spell, in all scenarios and years driven by an increase of its gas demand for power generation due to the limited availability of renewable power generation for two weeks.

Figure 4.90: Existing infrastructure level: Baltics States and Finland transit disruption under 2-week Dunkelflaute situation.
Low Infrastructure level
Simulation results show that the commissioning of some FID projects increases the cooperation between neighbouring countries in the area. Figure 4.91 shows the Low infrastructure level results described below:
2025
Coal Before Gas/Gas Before Coal
Finland is still exposed to a risk of demand curtailment in both scenarios. The risk of demand curtailment in Finland decreases from 84 – 85 % (Coal before Gas and Gas before Coal respectively) in Existing infrastructure level to 69 – 72 % thanks to the second capacity increment of the FID Project Balticconnector.
As a result of the increase of the cooperation between Estonia-Finland, Estonia shares Finland’s risk of demand curtailment up to the same extend 68 – 70 % (Coal before Gas and Gas before Coal respectively).
Additionally, result show infrastructure gaps in the area, with limited capacity from Latvia to Estonia together with absence of indigenous production in Finland and a very low indigenous production coming from biomethane in Estonia.
2030 – 2040
National Trends
As for 2025 scenarios, the commissioning of the capacity increment in Balticconnector increases the cooperation between Estonia- Finland. As a result, Finland decreases its risk of demand curtailment while Estonia shares Finland’s risk of demand curtailment up to the same extent.
Additionally, result show infrastructure gaps in the area, with limited capacity from Latvia to Estonia combined with a very low indigenous production coming from biomethane in Finland and Estonia.
COP 21 scenarios
Distributed Energy and
Global Ambition
As for 2025 scenarios, the commissioning of the capacity increment in Balticconnector increases the cooperation between Estonia-Finland, as a result Finland decreases its risk of demand curtailment while Estonia shares Finland’s risk of demand curtailment up to the same extent for both scenarios and years. In 2040 the situation improves thanks to lower demand together with higher indigenous production in both countries and scenarios.

Figure 4.91: Low infrastructure level: Baltics States and Finland transit disruption under 2-week Dunkelflaute situation.
Advanced Infrastructure level
Simulation results show that advanced-status projects provide an infrastructure reinforcement in the Baltic states helping to cope with high demand situations. Figure 4.92 shows the Advanced infrastructure level results described below.
2025
Coal Before Gas/Gas Before Coal
Simulation results show that advanced-status projects fully mitigate the risk of demand curtailment in Estonia from 2025 onwards with the commissioning of one LNG terminal project in 2022.
Nevertheless, Finland is still exposed to a lesser extent of risk of demand curtailment (59 – 64 % in Coal Before Gas and Gas Before Coal respectively), being the Balticconnector capacity fully used.
2030-2040
National Trends
As for 2025 scenarios, Estonia fully mitigates its risk of demand curtailment thanks to the commissioning of one LNG terminal project in 2025. The cooperation between Estonia-Finland is limited by the Balticconnector’s capacity, nevertheless, Finland reduce its risk of demand curtailment from 70 – 68 % (in 2030 – 2040 espectively) in Low infrastructure level to 61 – 57 % (in 2030 – 2040 respectively) in the Advanced infrastructure level.
COP 21 scenarios
Distributed Energy and
Global Ambition
As for National Trends and 2025 scenarios, Estonia fully mitigates its risk of demand curtailment thanks to the commissioning of one LNG terminal project in 2025. Nevertheless, Finland is still exposed to a lesser extent of risk of demand curtailment, being the Balticconnector capacity fully used.

Figure 4.92: Advanced infrastructure level: Baltics States and Finland transit disruption under 2-week Dunkelflaute situation.
PCI Infrastructure level
This infrastructure level assesses the different scenarios under 2-week Dunkelflaute demand together with Baltics States and Finland transit disruption against the current European gas system infrastructure complemented with FID projects (Low infrastructure level) and all projects included in the latest 4th PCI list showing the benefits stemming from the implementation of the latest PCI list. Results are in line with Low infrastructure level assessment. Figure 4.93 shows the evolution of the PCI infrastructure level.

Figure 4.93: PCI infrastructure level: Baltics States and Finland transit disruption under 2-week Dunkelflaute situation.


