The gas infrastructure can integrate significant volumes of intermittent renewables
The assessment confirms that the existing gas system can support the development of renewable gases and renewable electricity by integrating all the potential biomethane and renewable hydrogen as defined in the different scenarios, the necessary adaptations of the existing gas network are undertaken. The potential of the gas system combined with significant volumes of storage is perfectly adequate to cope with the intermittent renewable generation.
The gas system and its storage capacity are key to cope with the seasonality of the energy demand
On an annual basis the gas infrastructure generally offers the necessary flexibility to balance the seasonal inadequacy between the energy supply (rather stable over the year) and the energy demand (high in winter and low in summer). The assessment confirms that the existing gas system can store more than 30 % of the current and future winter demand. This is another key element for integrating very seasonal supply such as solar energy without having to curtail other forms of renewable energy generation.
In case of high demand situations under climatic stress, the role of gas storages in the gas system prove to be necessary for security of supply, since most of the gas supply delivered in peak demand situations comes from the gas storages (8,500 GWh/d to 15,500 GWh/d). In case of Dunkelflaute event, the share of the supply coming from the storages can go up to 40 % for 2 consecutive weeks, demonstrating the role of the gas infrastructure as a necessary infrastructure to support the development of intermittent renewables while ensuring security of energy supply for the EU.
Development of renewables bring flexibility on annual level but import capacities are needed to ensure security of supply in peak situations
The assessment of the gas infrastructure under Distributed Energy show that even with a significant share of indigenous renewable production, the storages need imports to be filled up in summer and additionally, imports are a key complement to storage withdrawals in winter.
Furthermore, the analysis of the supply mixes under various price configurations confirms that the gas infrastructure allows for the market to make arbitration between cheap and expensive supply source to minimise the cost of gas supply for the EU. Additional infrastructure also proves to be giving access to alternative supply sources increasing the security of gas supply in some countries.
The assessment of Low and Advanced infrastructure levels generally bring more flexibility to the gas system. See Figure 4.107.
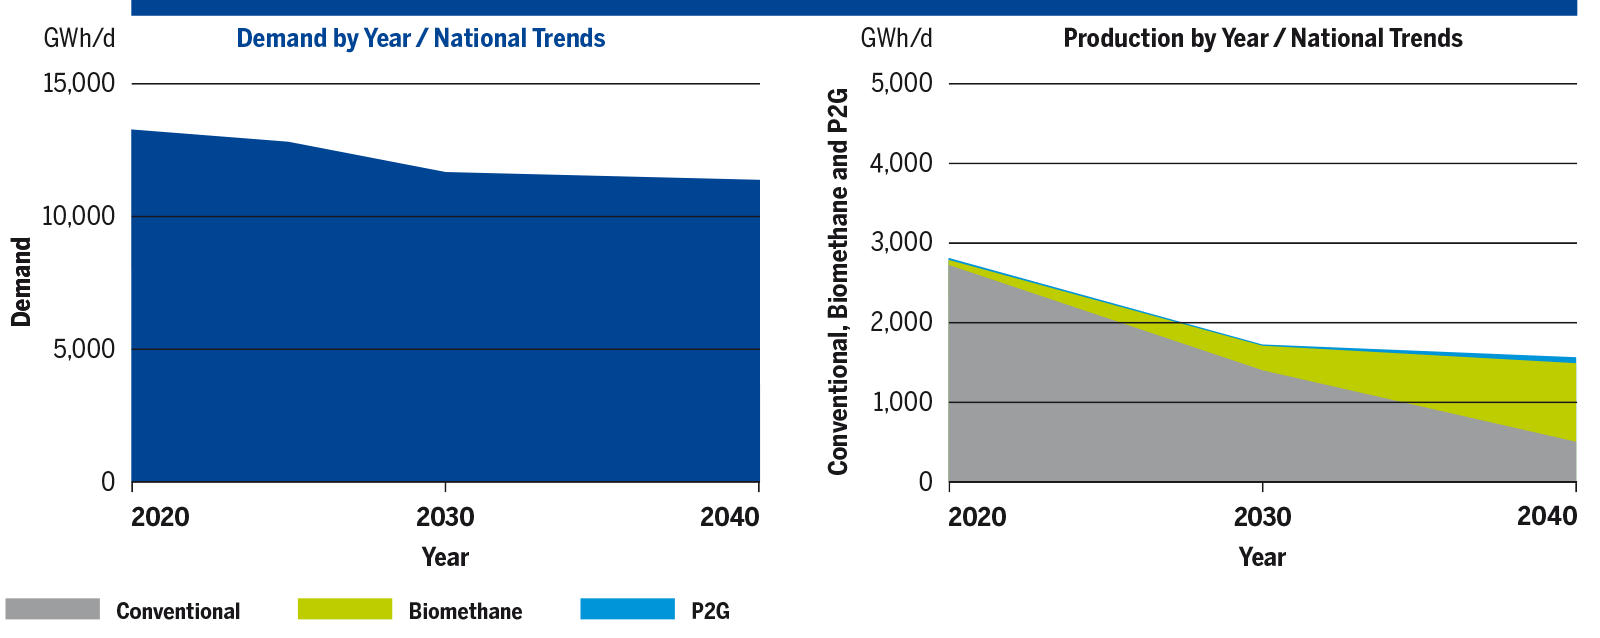
Figure 4.107: Annual demand and supply in TYNDP scenarios in the EU in GWh/d.
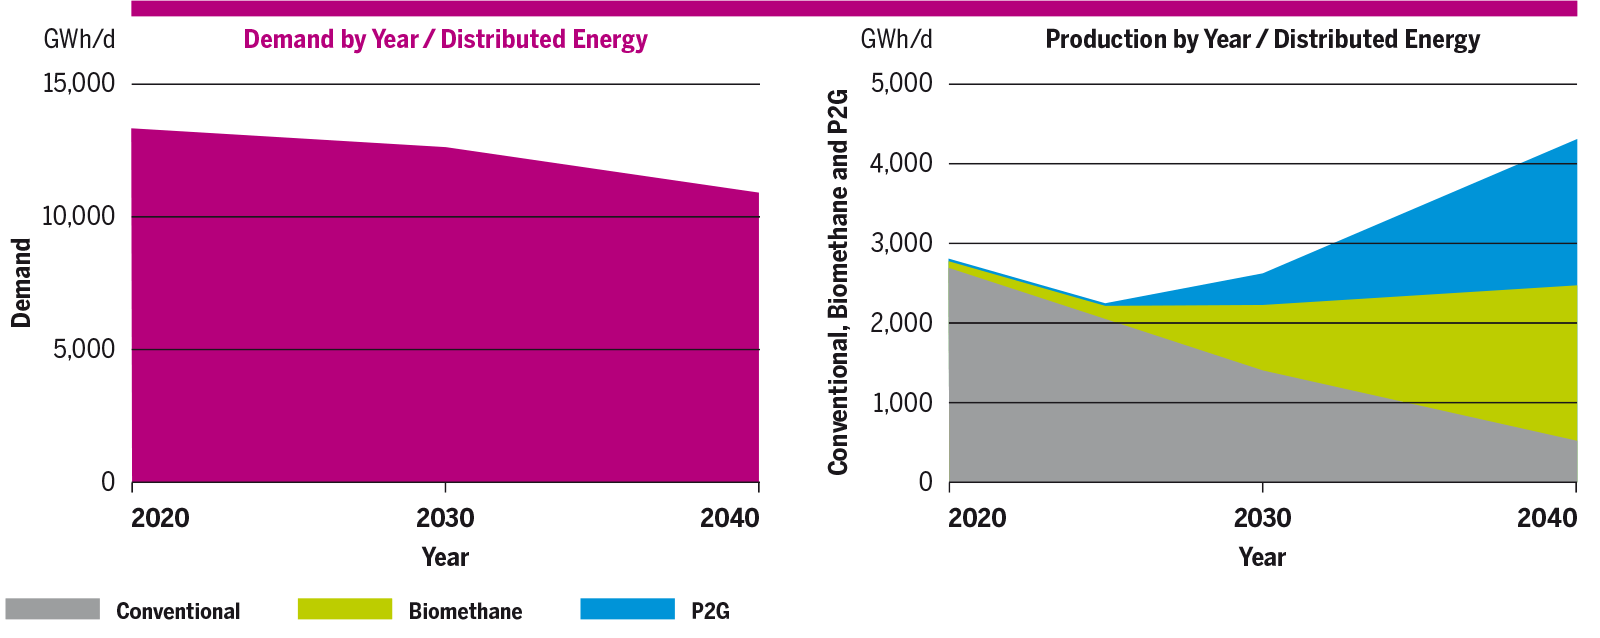
Figure 4.107: Annual demand and supply in TYNDP scenarios in the EU in GWh/d.
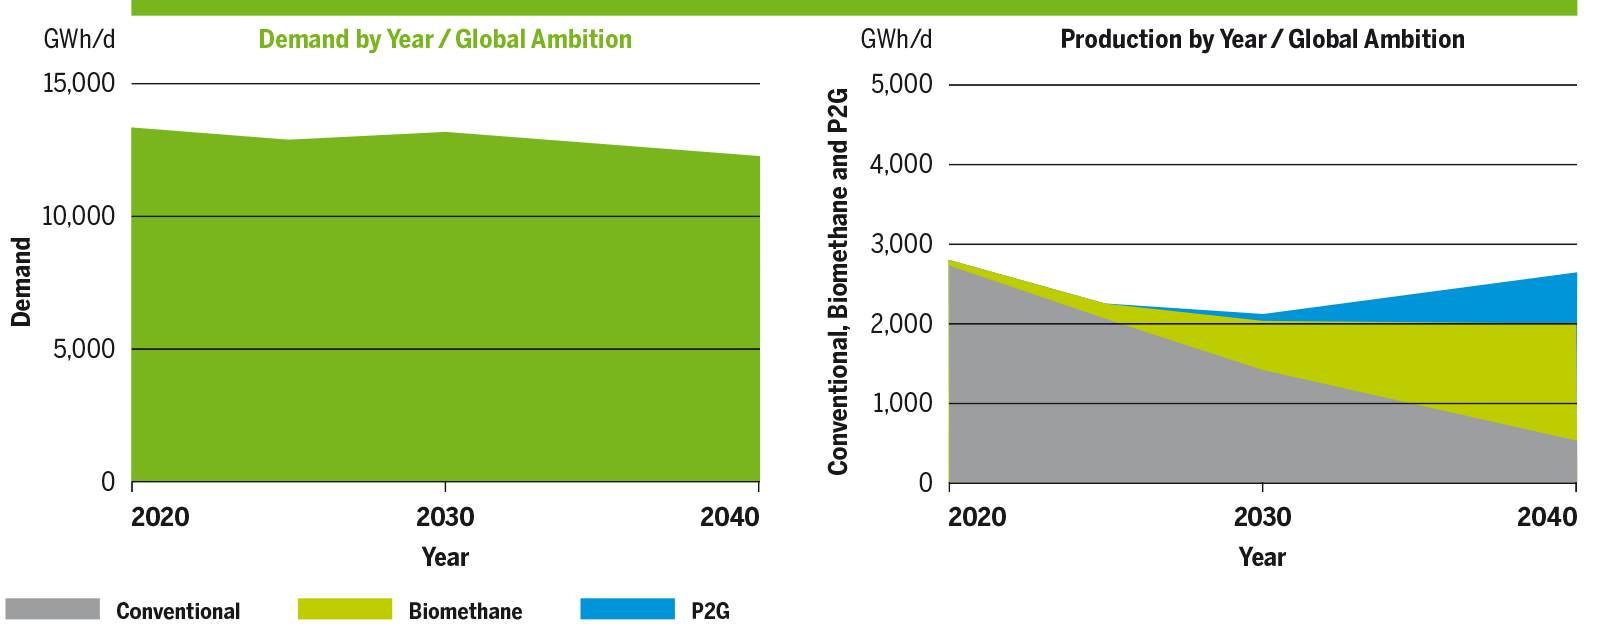
Figure 4.107: Annual demand and supply in TYNDP scenarios in the EU in GWh/d.
4.3.1 Supply mixes under high demand situations
Under high demand situations the supply and demand balance depend on a significant share of the underground gas storage utilisation while the share of the main supply sources remain quite stable over the years with a decrease, in absolute values, of LNG supply1 and Norwegian gas over the years. The gas infrastructure enhances the security of gas supply in Europe in the different scenarios and years with enough import capacities and supporting the Energy Transition in very different ways, not only by enhancing the penetration of renewables gas production, but also as back up for intermittent power generation. The following charts illustrate the evolution in the different scenarios. See Figure 4.108.
In National Trends, the decline of the conventional natural gas production over the years is not compensated by the limited development of renewable and decarbonised gases. The supply and demand balance relies on a rather stable levels of imports shares and a significant share of storages utilisation over time, showing resilience to high demand situation in most of the EU.
In Distributed Energy, the gas system supports the integration of significant levels of renewable gas production in Europe compensating the decline of conventional natural gas. Under peak demand situations, the gas demand decreases overall. However, the increase in gas demand for power generation compensates partially for the decreasing gas demand in other sectors. The increasing share of indigenous renewable gas production, especially non-intermittent such as biomethane, allows for more flexibility imports/storage in the system to satisfy the demand. Nevertheless, the gas storages still provide 30 % (8,500 GWh/d) of the peak flexibility in 2040.
In Global Ambition, the gas European gas system can be part of a global transition where renewable and decarbonised gas can be imported. Therefore, the gas system copes with peak demand situations relying mainly on gas storages and imports while the increasing share of indigenous production bring some flexibility.
The evolution of the supply mixes share in Low and Advanced infrastructure level, follow the same trend as for existing infrastructure level.
1 In high demand situations such as peak days, the LNG supply is not limited to the possible LNG imports, but additionally includes the supply from the LNG tanks, acting like a gas storage for exceptional situations.
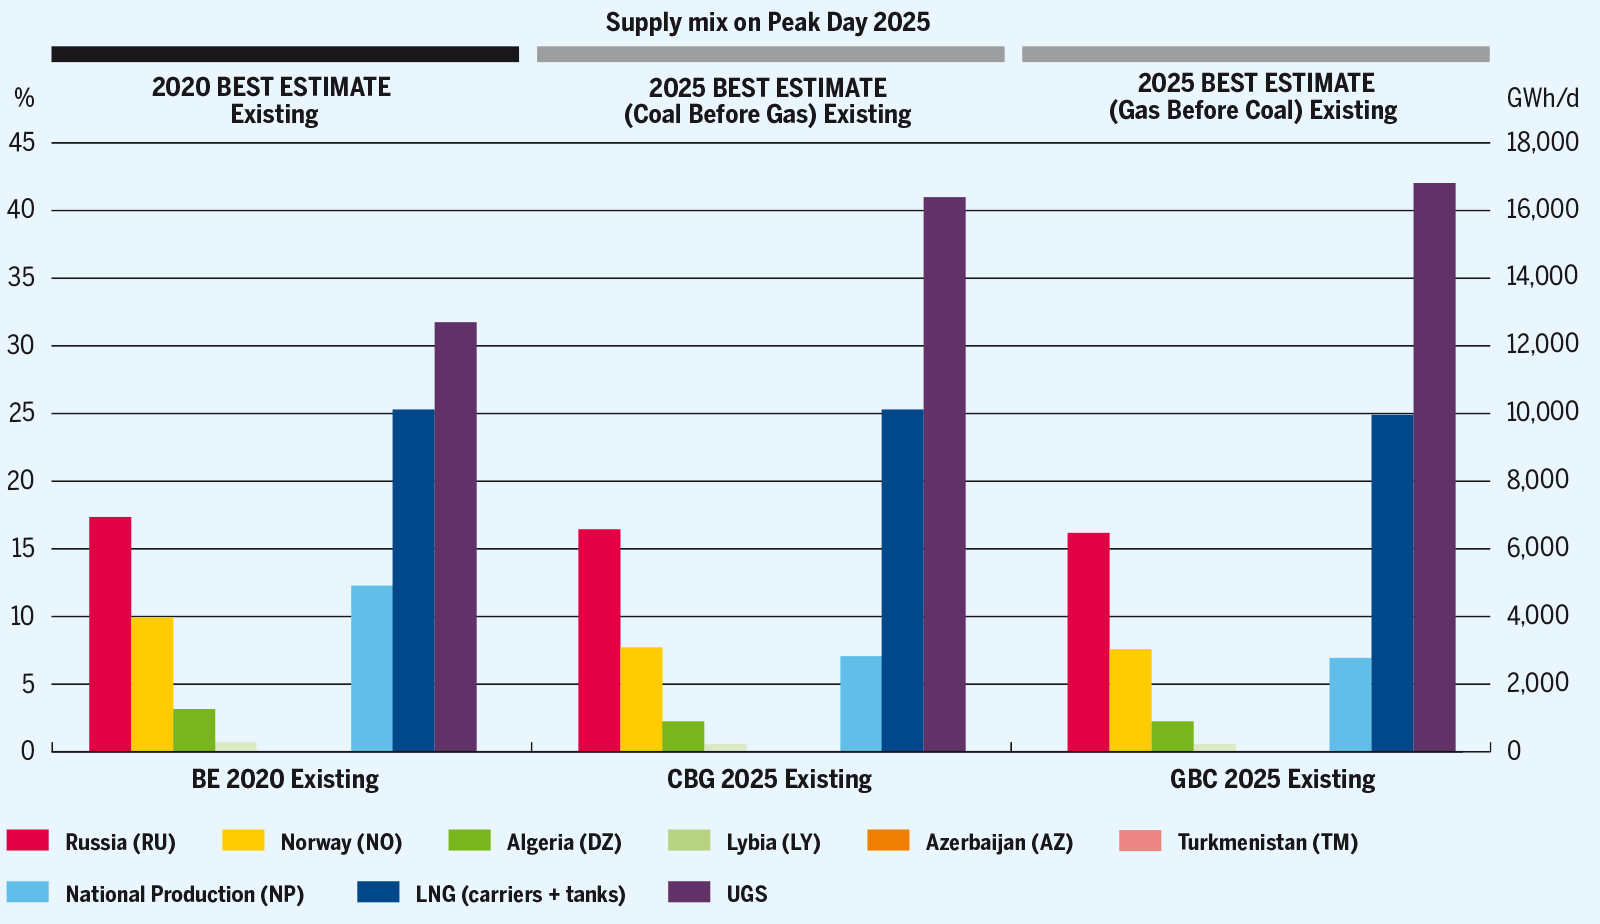
Figure 4.108: Evolution of the share of supply mixes under peak demand situation, Existing infrastructure level.
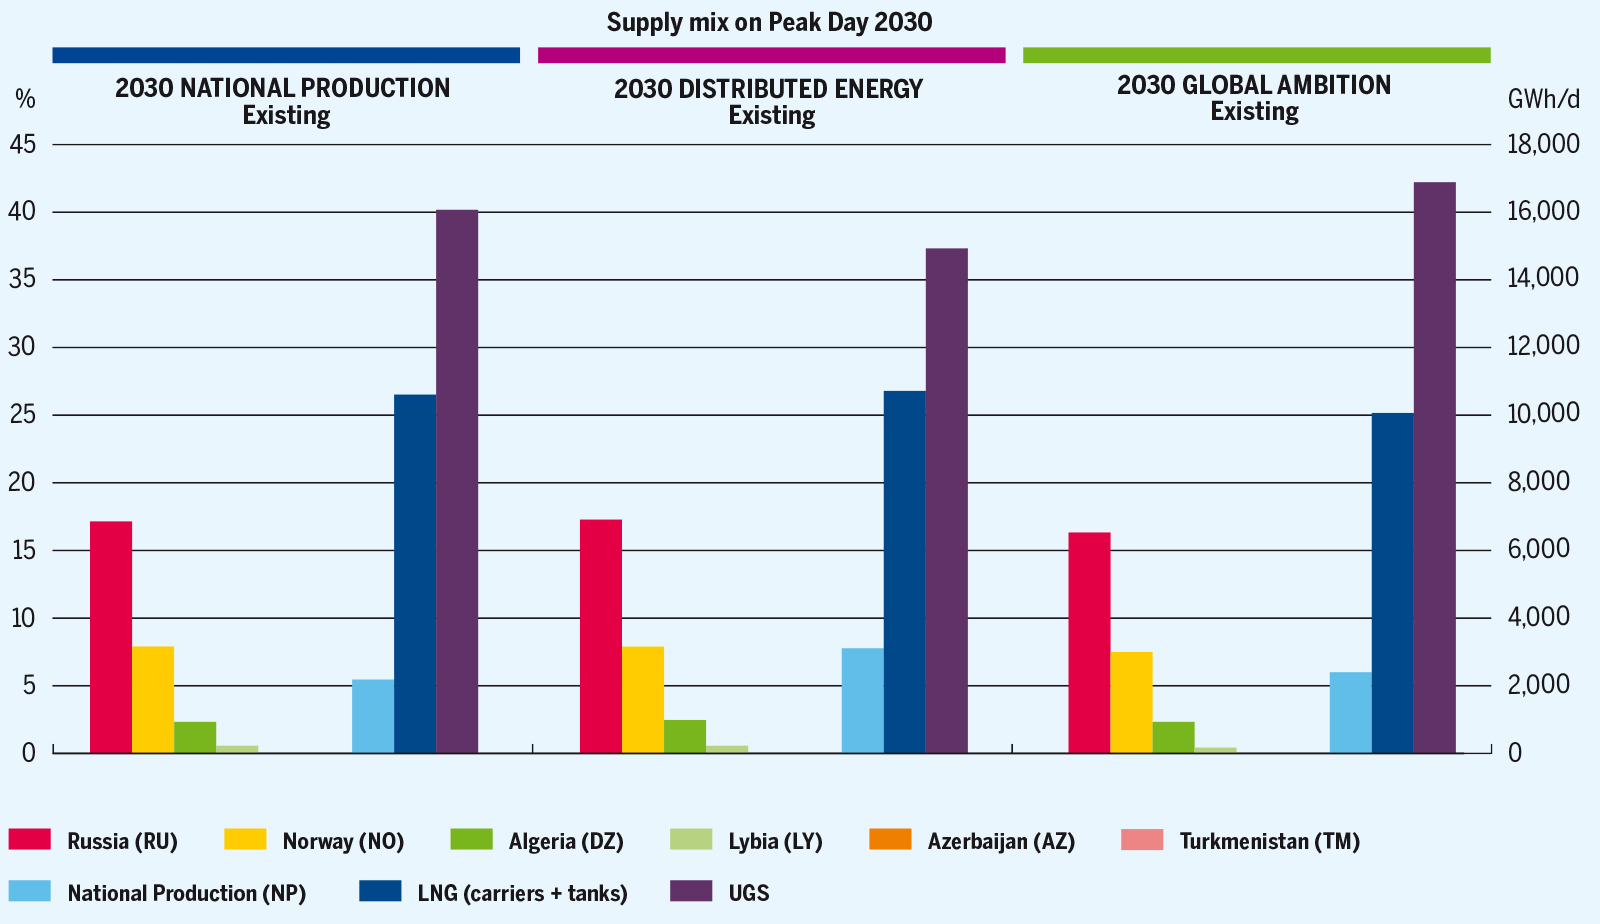
Figure 4.108: Evolution of the share of supply mixes under peak demand situation, Existing infrastructure level.
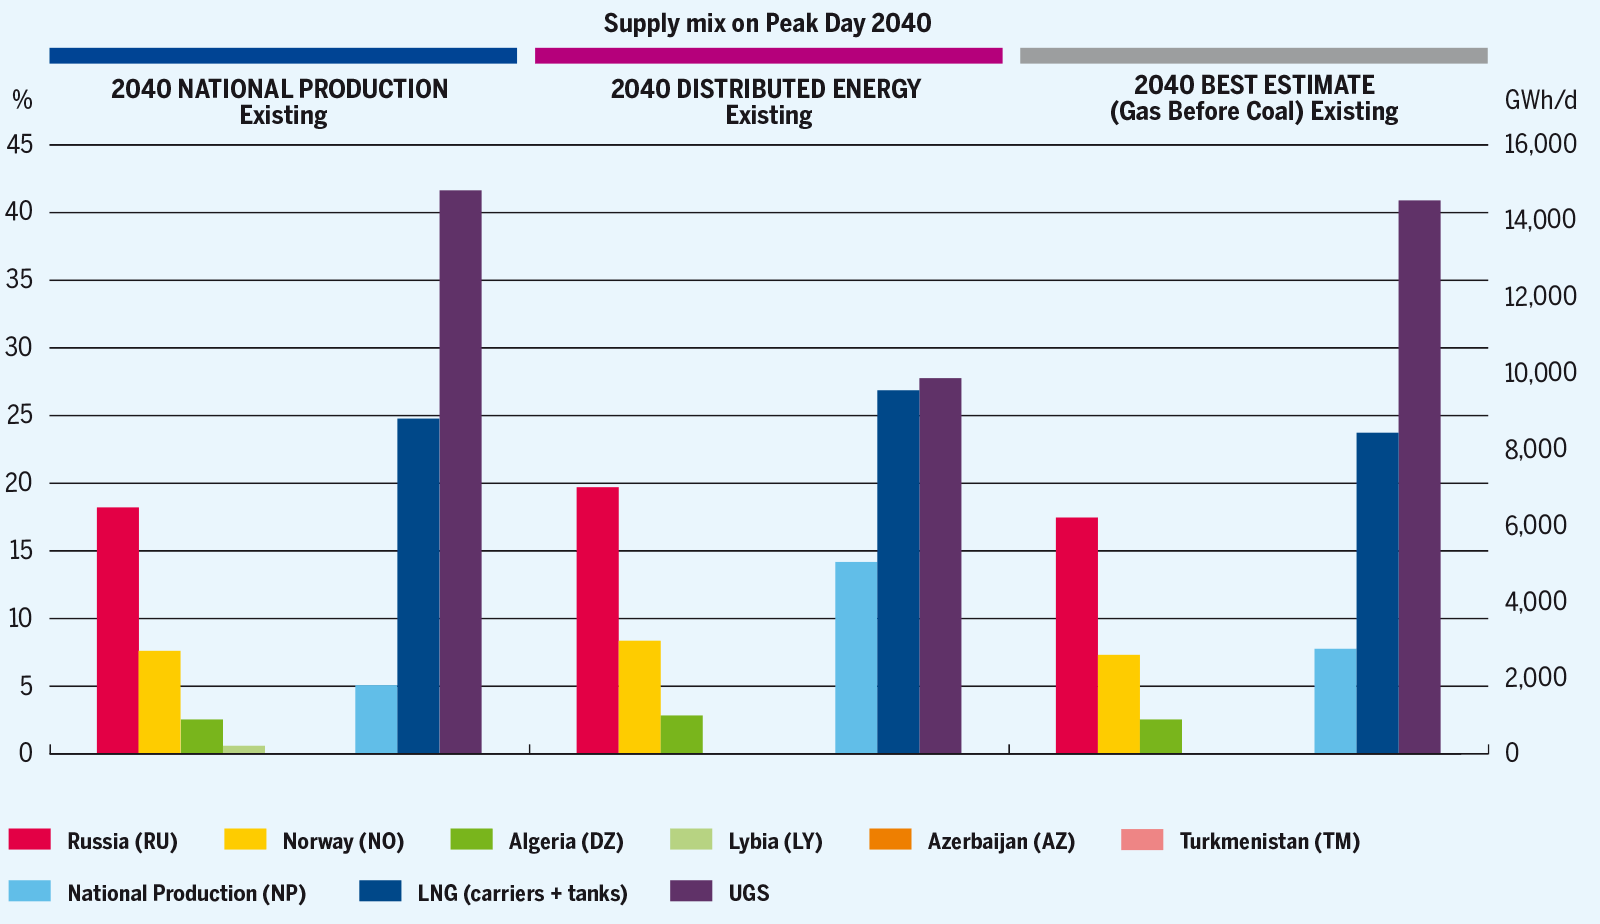
Figure 4.108: Evolution of the share of supply mixes under peak demand situation, Existing infrastructure level.
4.3.2 Annual EU supply mix per configuration
This part analyses the impact of contrasted EU supply mixes on the EU supply and demand balance and gas infrastructure. This is achieved through supply configurations intended at maximising, or respectively minimising, specific supply sources such as Russian gas and LNG.
Figures 4.109 – 4.112 show the EU annual supply and demand balance for the years 2020, 2025, 2030 and 2040 for these contrasted supply mixes and the range for each supply source.
At EU-level, the Existing and Low infrastructure levels allow each source to reach its maximum potential, under the corresponding contrasted supply mix. Moreover, the gas infrastructure is well developed making use of the cheapest supply as the different price configurations show.
The infrastructure in the Low infrastructure level also provides high flexibility at EU-level. This is shown by the wide range of possible supply mixes. This can be mainly observed on the long run, where the supply flexibilities are wider.
The assessment of how marginal gas prices can further align throughout the EU is developed in the Market Integration and Competition chapter. See Figures 4.109 – 4.114.
Policy scenario
- Best Estimate 2020
- Best Estimate (Gas Before Coal) 2025, Existing infrastructure level
- Best Estimate (Gas Before Coal) 2025, Low infrastructure level
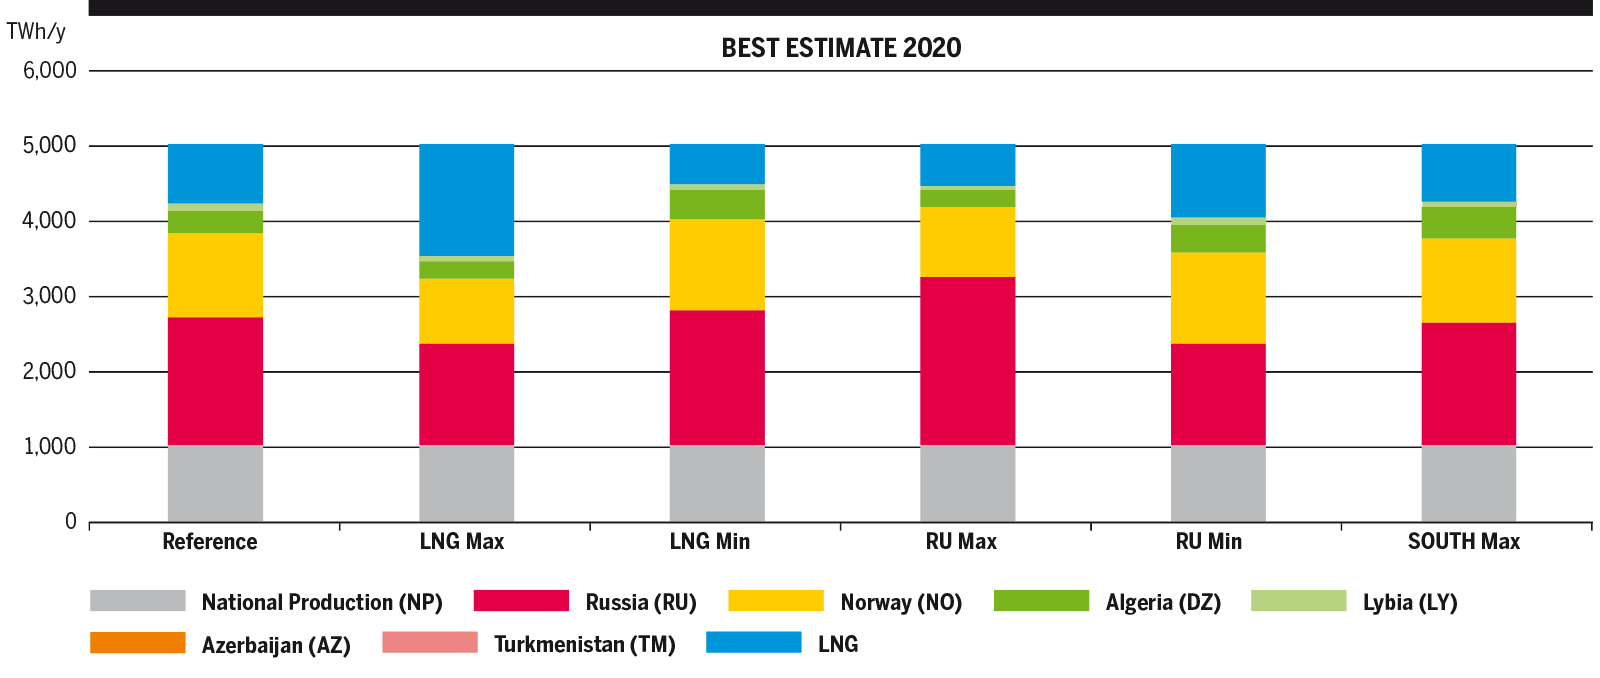
Figure 4.109: Annual EU supply mix per configuration 2020 – 2025.
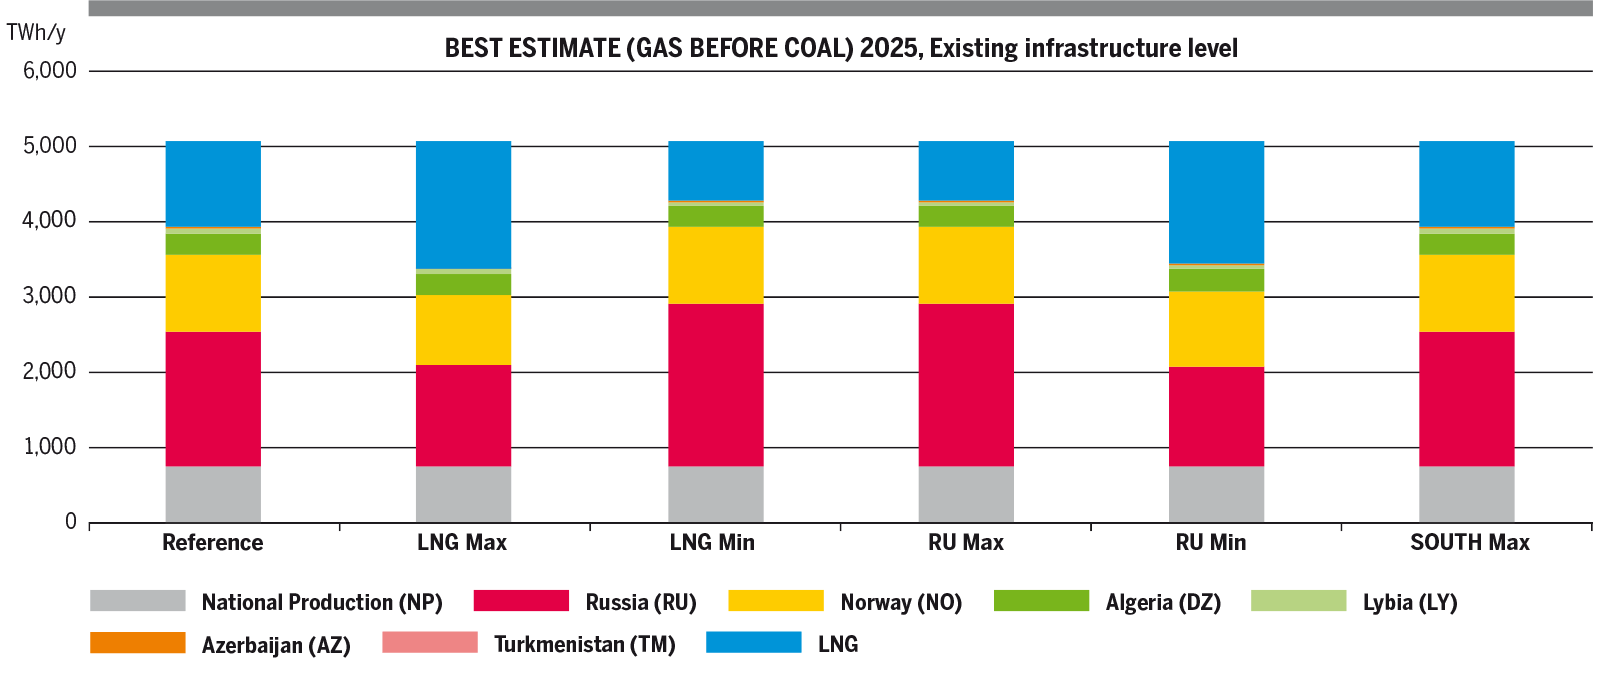
Figure 4.109: Annual EU supply mix per configuration 2020 – 2025.
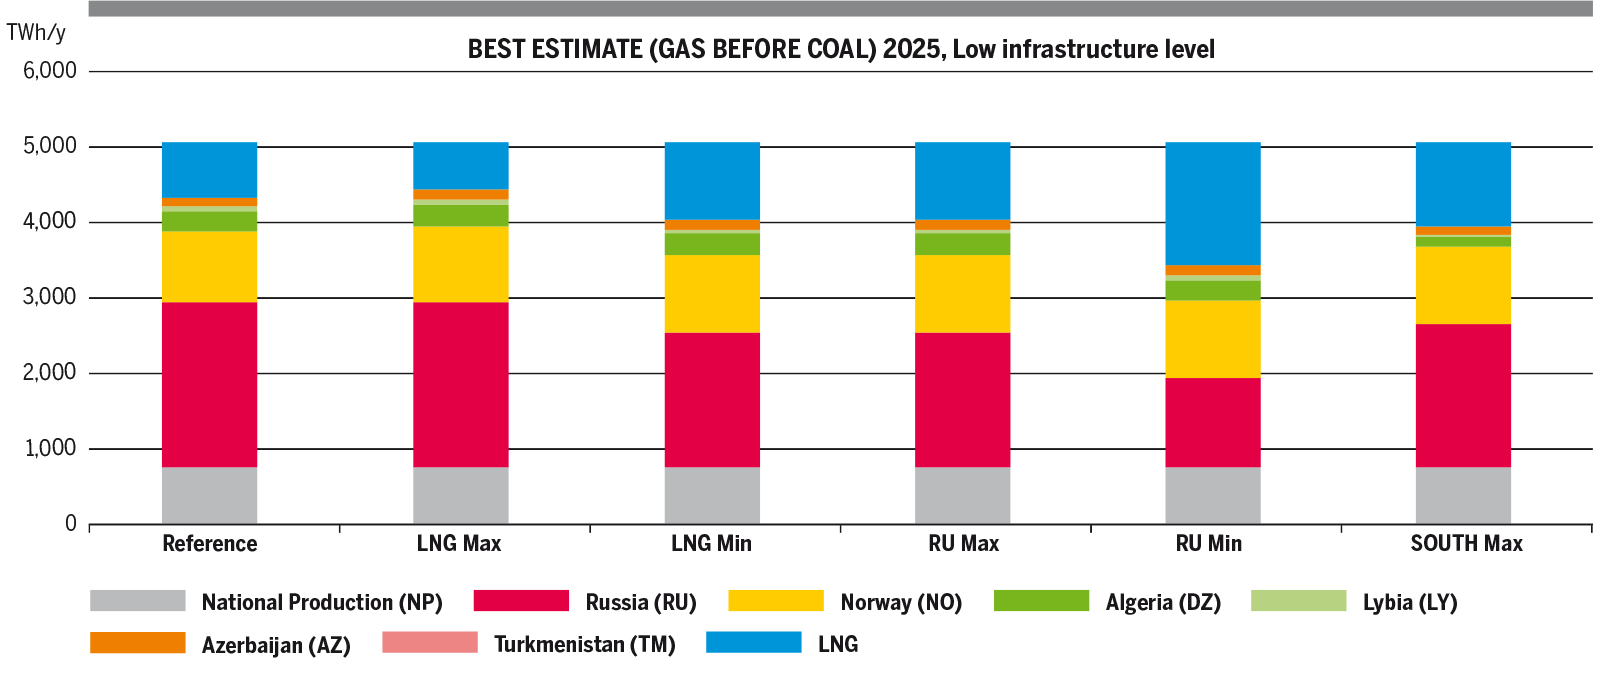
Figure 4.109: Annual EU supply mix per configuration 2020 – 2025.
- NATIONAL TRENDS 2030, Existing infrastructure level
- NATIONAL TRENDS 2030, Low infrastructure level
- NATIONAL TRENDS 2040, Existing infrastructure level
- NATIONAL TRENDS 2040, Low infrastructure level
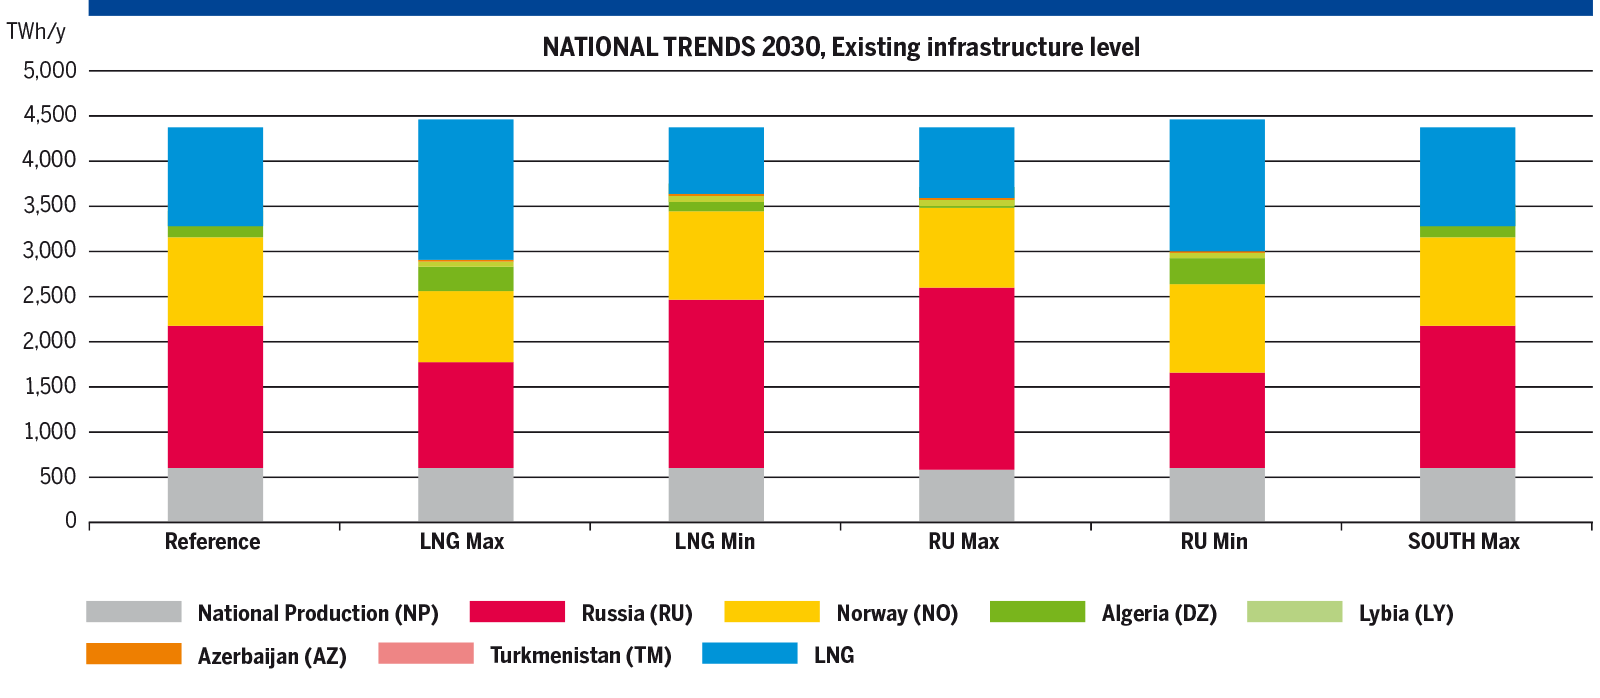
Figure 4.110: Annual EU supply mix per configuration, National Trends 2030 – 2040.
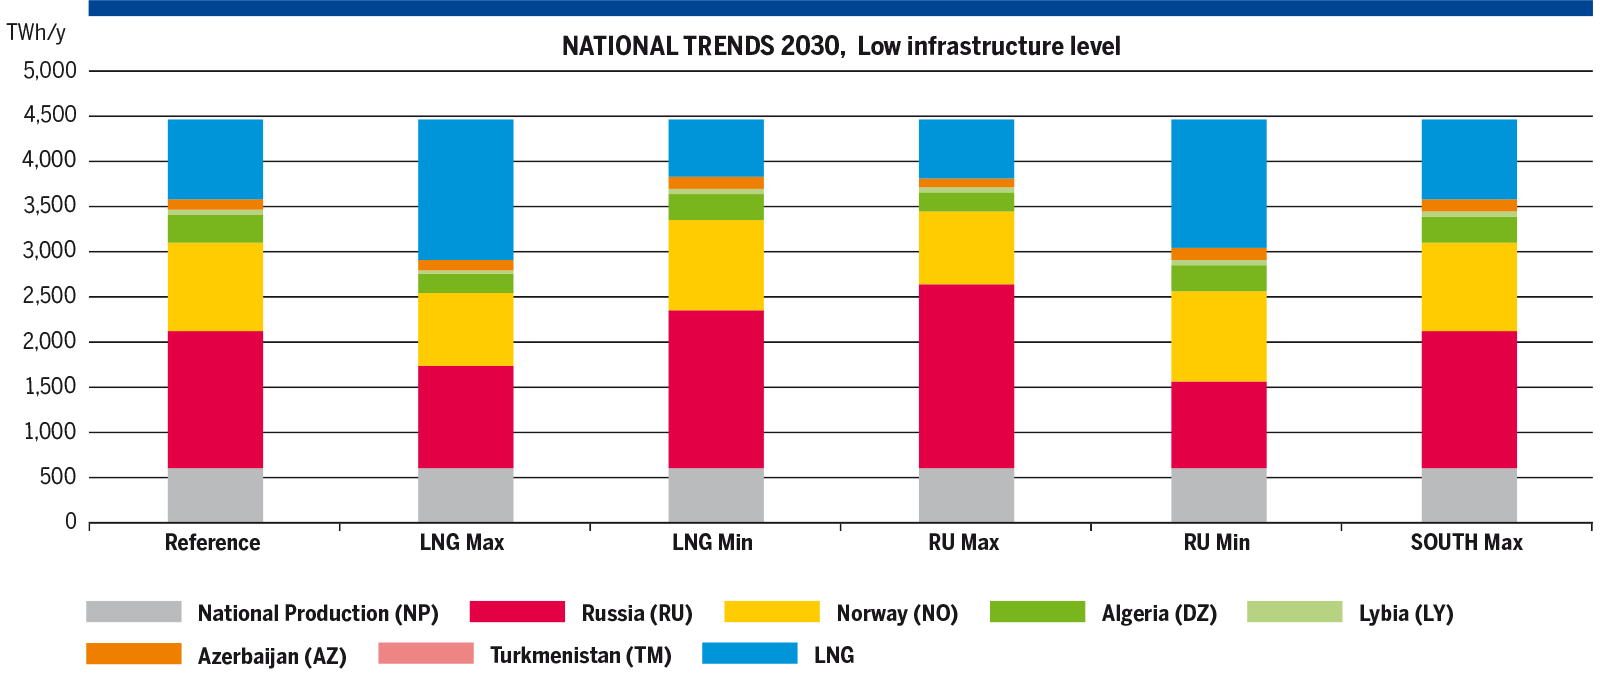
Figure 4.110: Annual EU supply mix per configuration, National Trends 2030 – 2040.
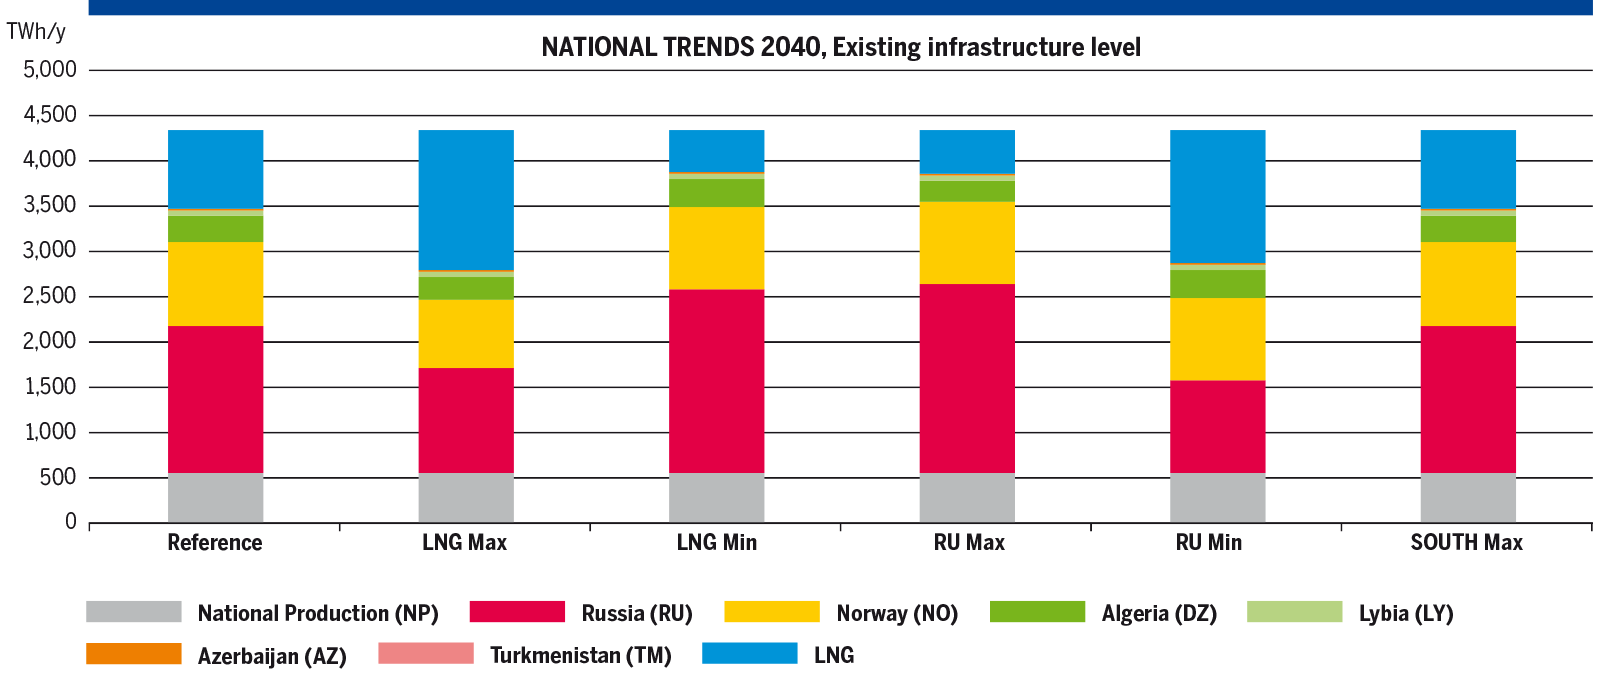
Figure 4.110: Annual EU supply mix per configuration, National Trends 2030 – 2040.
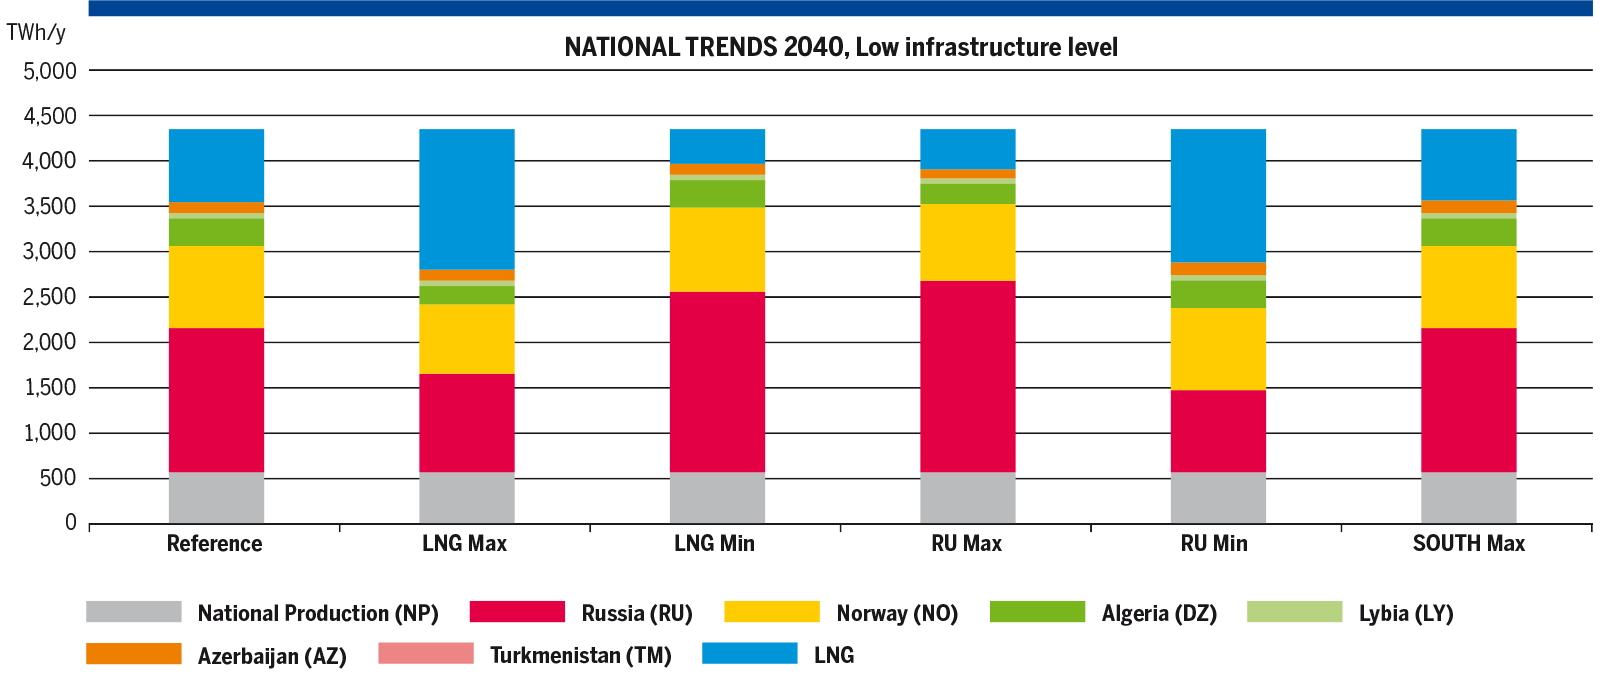
Figure 4.110: Annual EU supply mix per configuration, National Trends 2030 – 2040.
COP21 scenarios
- DISTRIBUTED ENERGY 2030, Existing infrastructure level
- DISTRIBUTED ENERGY 2030, Low infrastructure level
- DISTRIBUTED ENERGY 2040, Existing infrastructure level
- DISTRIBUTED ENERGY 2040, Low infrastructure level
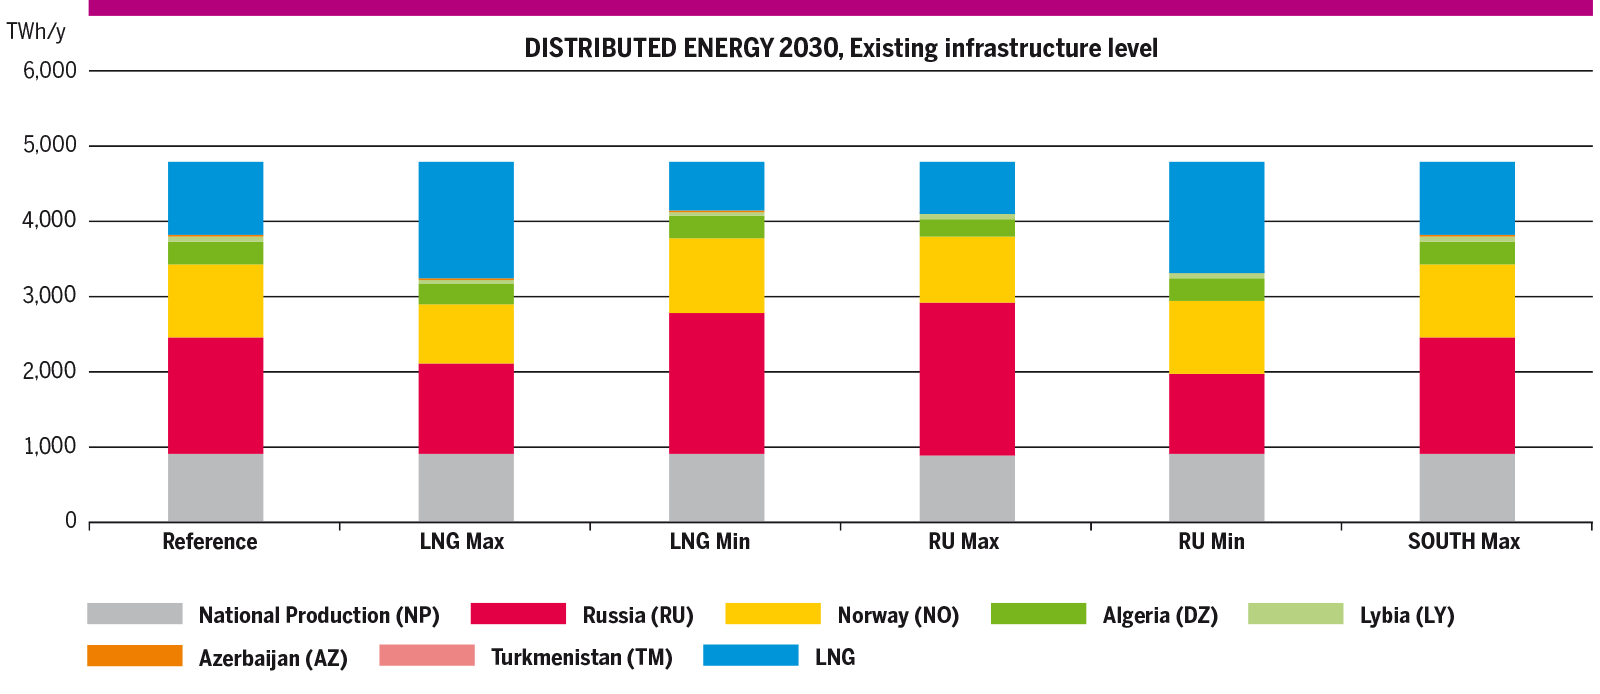
Figure 4.111: Annual EU supply mix per configuration, Distributed Energy 2030 – 2040.
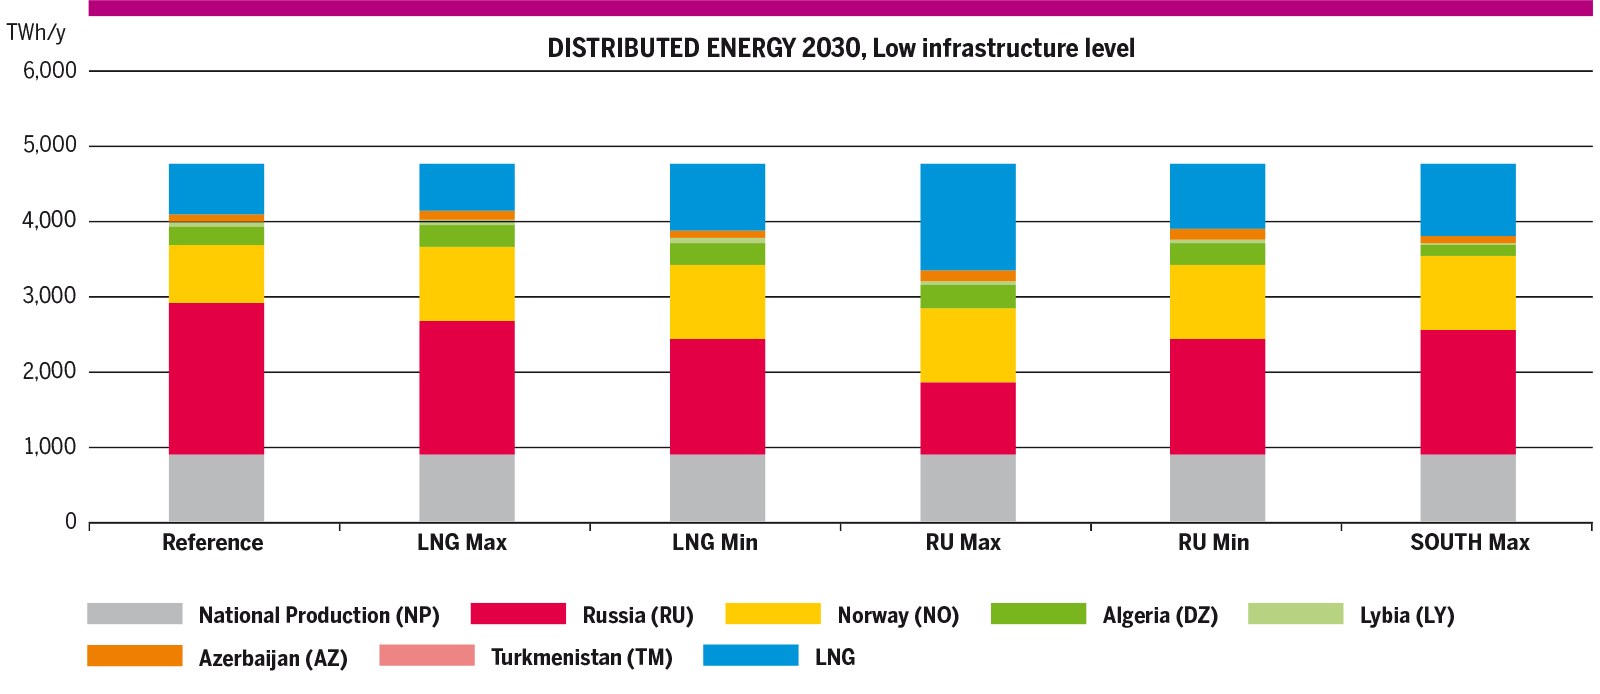
Figure 4.111: Annual EU supply mix per configuration, Distributed Energy 2030 – 2040.
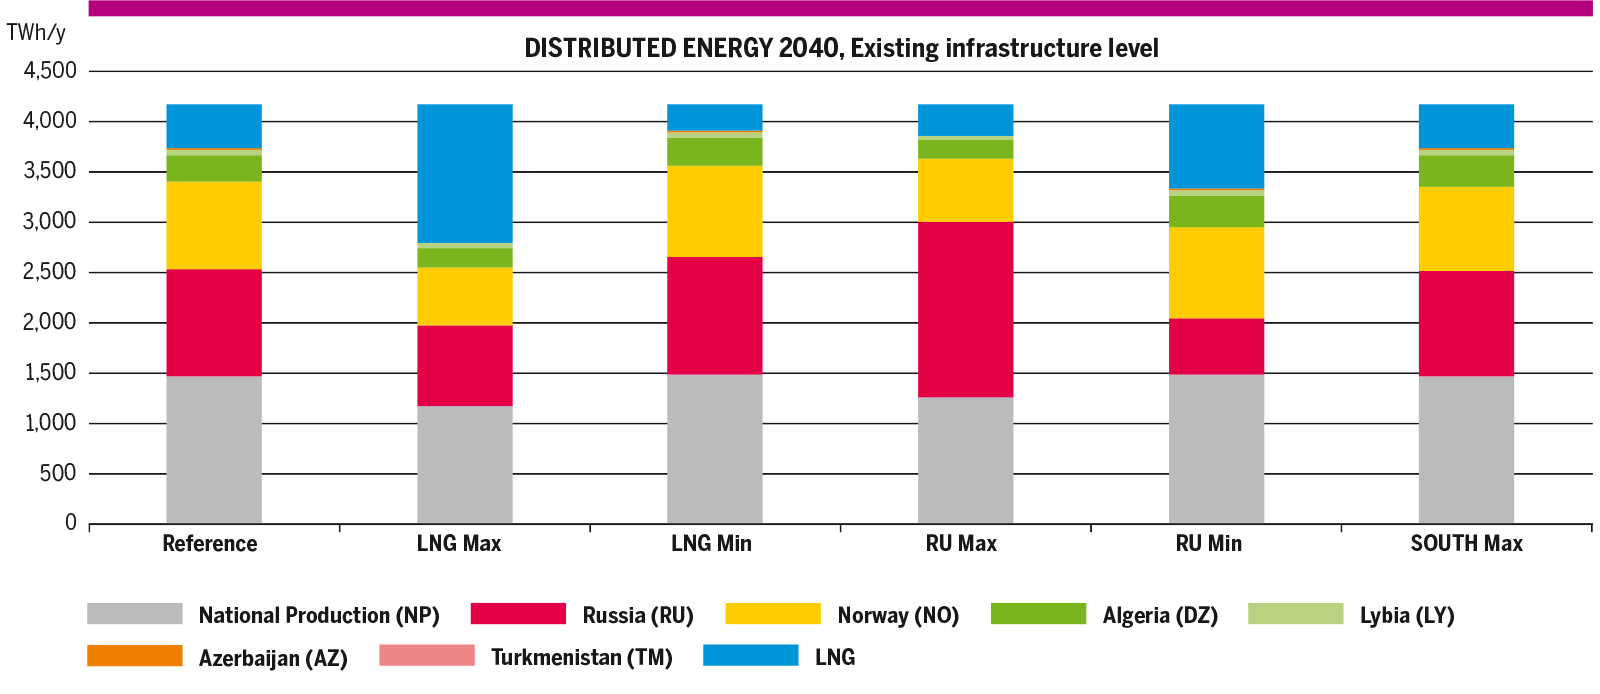
Figure 4.111: Annual EU supply mix per configuration, Distributed Energy 2030 – 2040.
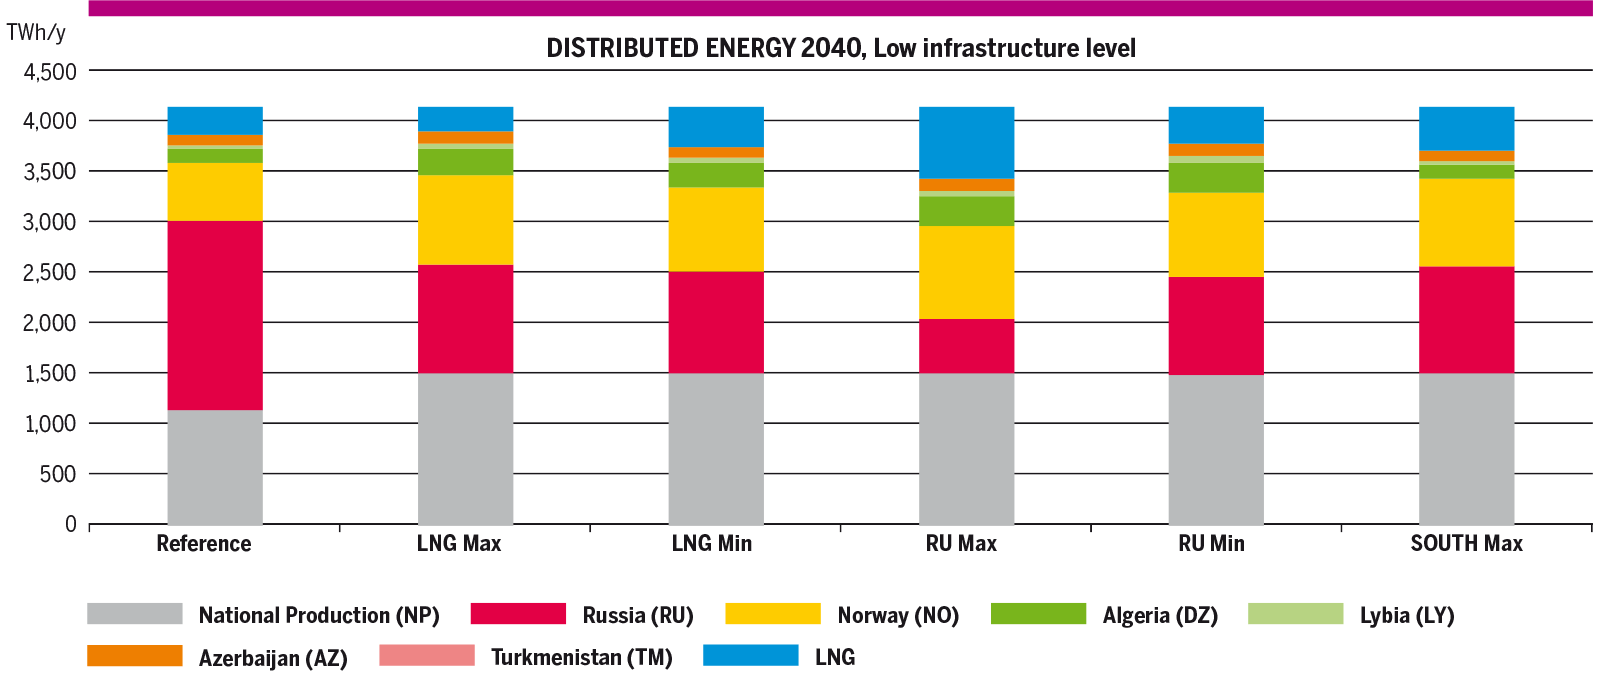
Figure 4.111: Annual EU supply mix per configuration, Distributed Energy 2030 – 2040.
- GLOBAL AMBITION 2030, Existing infrastructure level
- GLOBAL AMBITION 2030, Low infrastructure level
- GLOBAL AMBITION 2040, Existing infrastructure level
- GLOBAL AMBITION 2040, Low infrastructure level
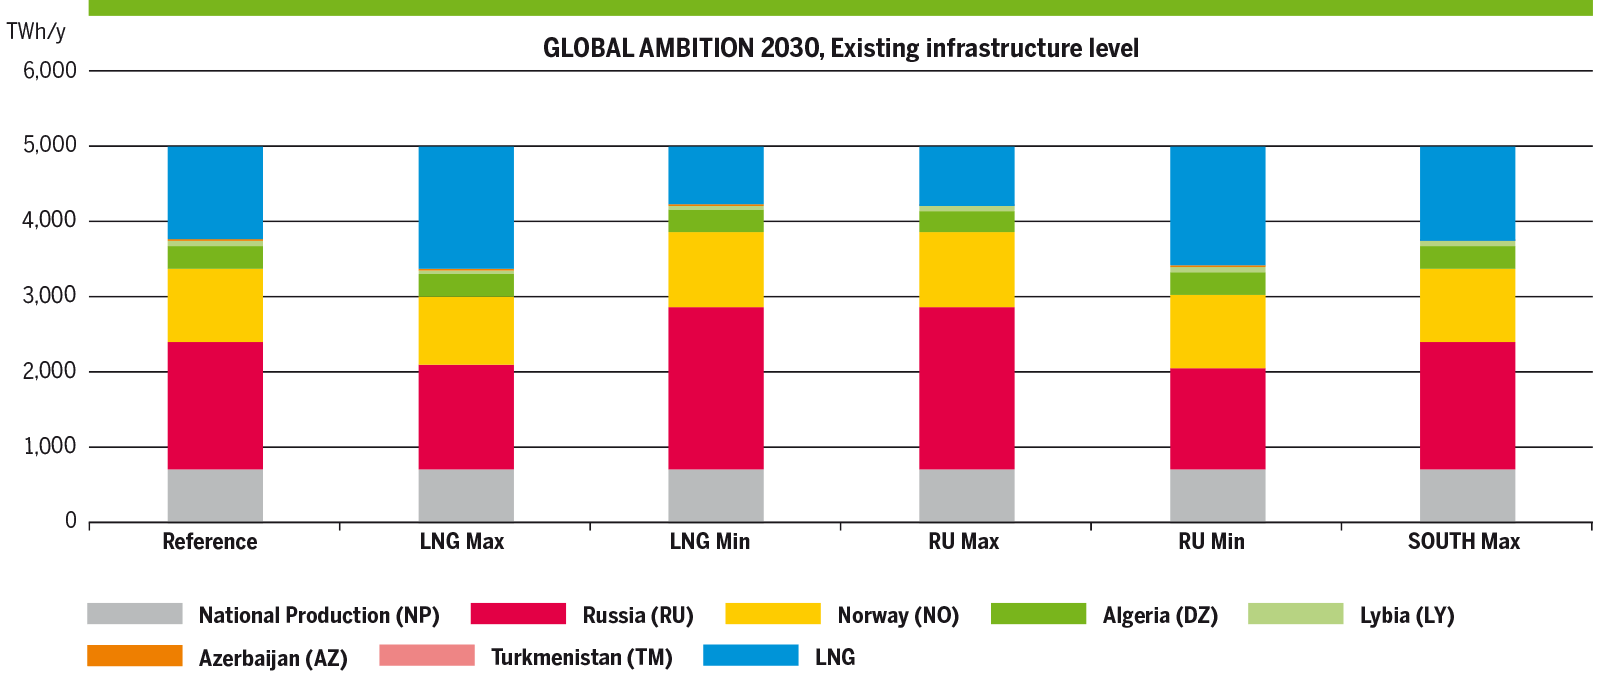
Figure 4.112: Annual EU supply mix per configuration, Global Ambition 2030 – 2040
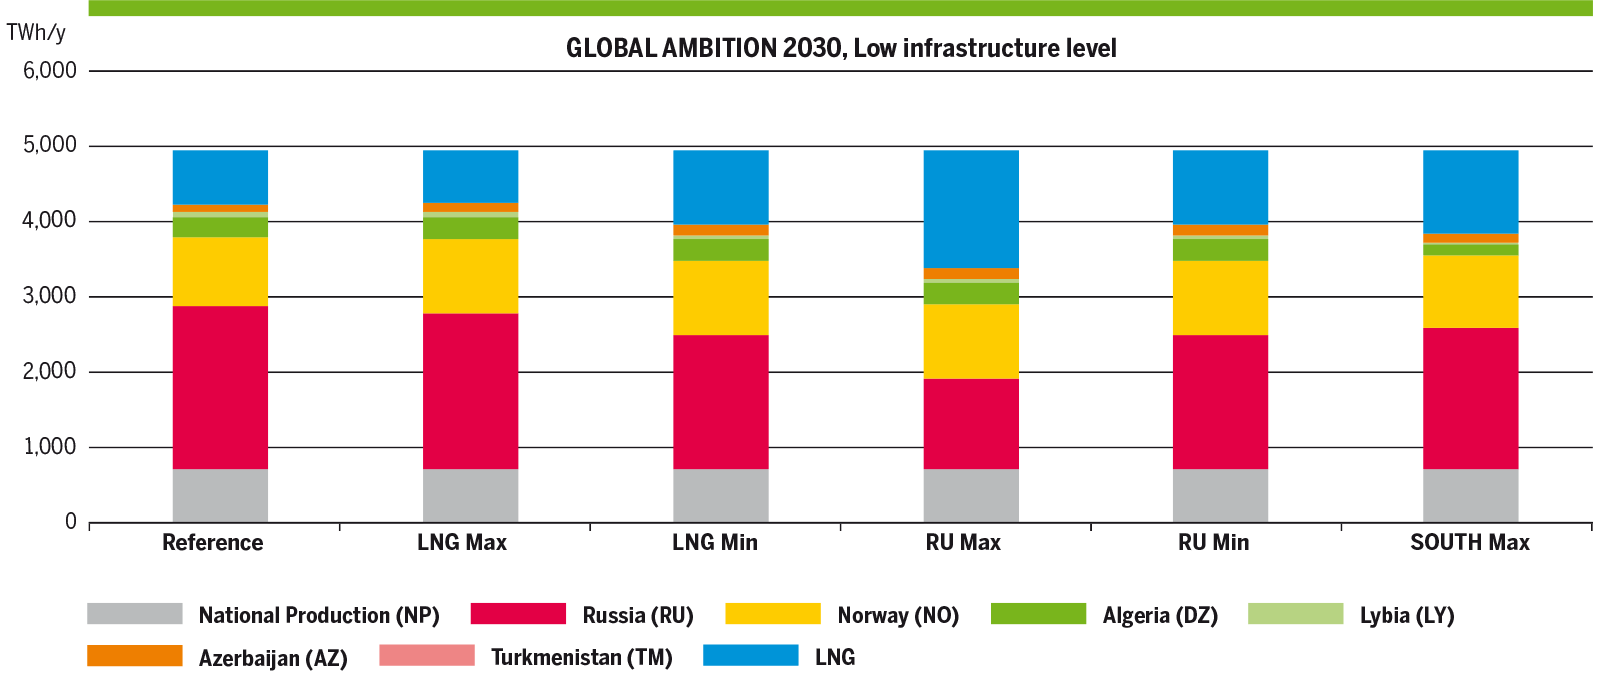
Figure 4.112: Annual EU supply mix per configuration, Global Ambition 2030 – 2040
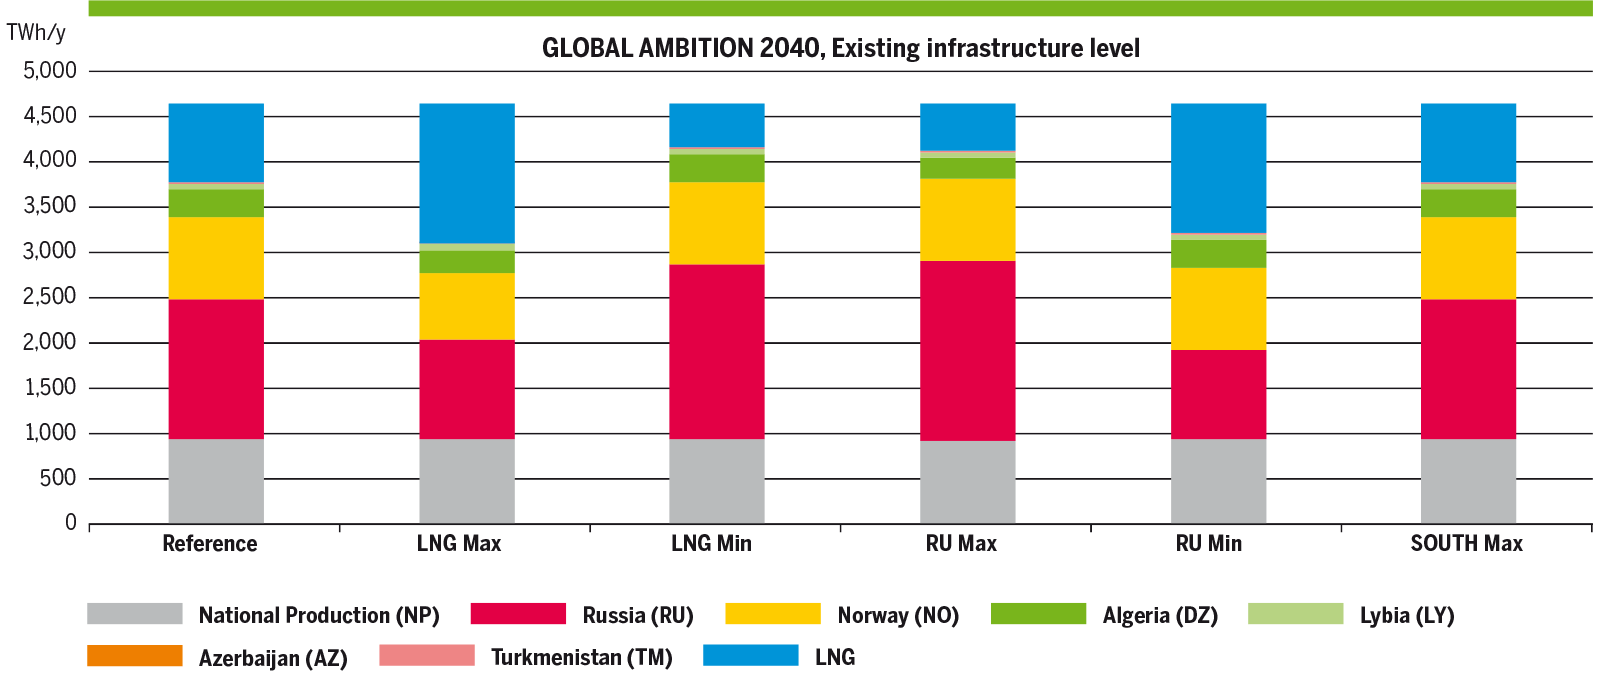
Figure 4.112: Annual EU supply mix per configuration, Global Ambition 2030 – 2040
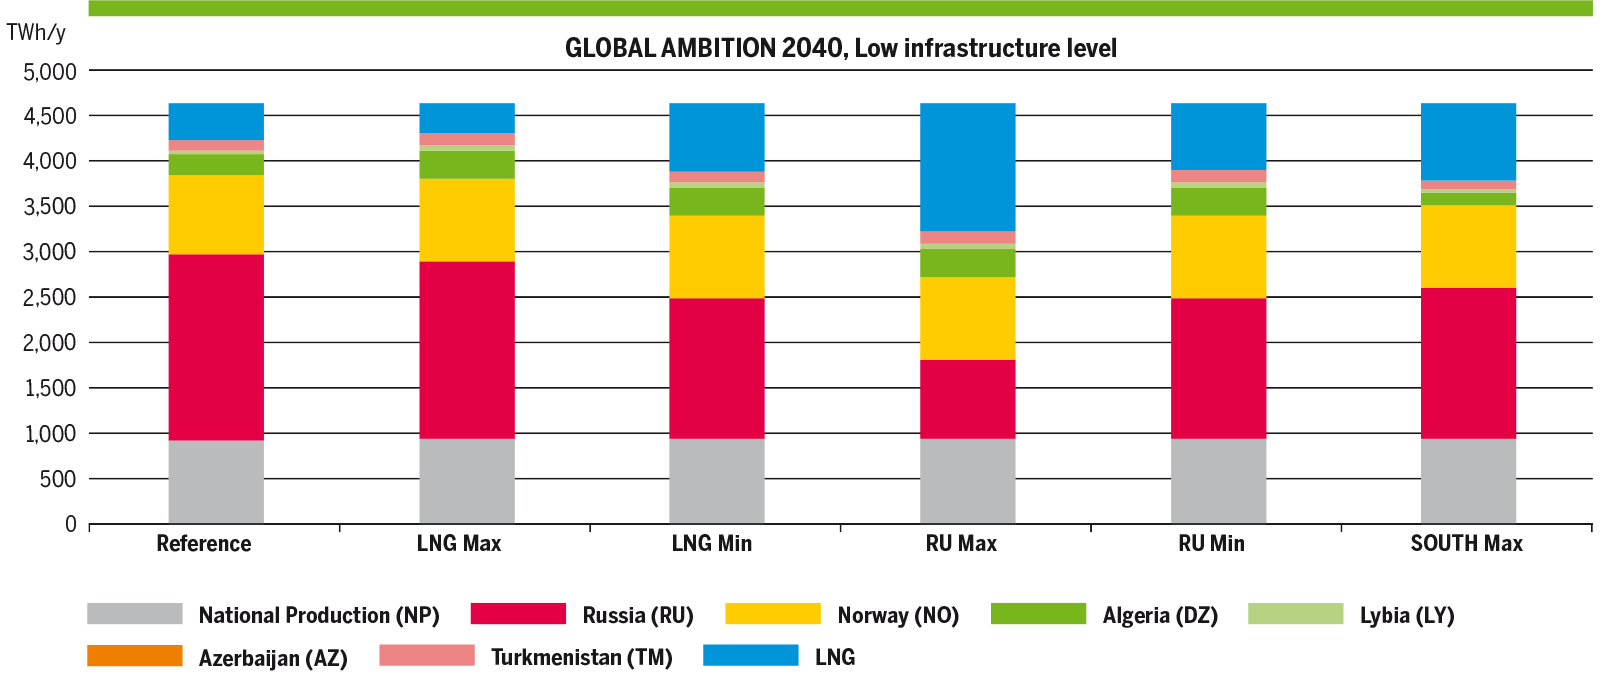
Figure 4.112: Annual EU supply mix per configuration, Global Ambition 2030 – 2040
| DZ | AZ | LNG | LY | NP | NO | RU | TM | ||
|---|---|---|---|---|---|---|---|---|---|
| 2020 | BEST ESTIMATE | 5% – 8% | 0% – 0% | 11% – 30% | 1% – 2% | 20% – 20% | 17% – 24% | 27% – 44% | 0% – 0% |
| 2025 | COAL BEFORE GAS | 5% – 6% | 0% – 0% | 13% – 34% | 1% – 1% | 15% – 15% | 18% – 21% | 24% – 44% | 0% – 0% |
| GAS BEFORE COAL | 6% – 6% | 0% – 0% | 15% – 33% | 1% – 1% | 14% – 14% | 18% – 20% | 26% – 43% | 0% – 0% | |
| 2030 | NATIONAL TRENDS | 5% – 7% | 0% – 0% | 14% – 35% | 1% – 1% | 13% – 13% | 18% – 22% | 24% – 45% | 0% – 0% |
| DISTRIBUTED ENERGY | 5% – 6% | 0% – 0% | 14% – 32% | 1% – 1% | 18% – 19% | 16% – 21% | 22% – 43% | 0% – 0% | |
| GLOBAL AMBITION | 6% – 6% | 0% – 0% | 15% – 32% | 1% – 1% | 14% – 14% | 18% – 20% | 27% – 43% | 0% – 0% | |
| 2040 | NATIONAL TRENDS | 6% – 7% | 0% – 0% | 11% – 36% | 1% – 1% | 13% – 13% | 17% – 21% | 23% – 48% | 0% – 0% |
| DISTRIBUTED ENERGY | 4% – 7% | 0% – 0% | 6% – 33% | 1% – 1% | 28% – 36% | 14% – 22% | 13% – 42% | 0% – 0% | |
| GLOBAL AMBITION | 5% – 7% | 0% – 0% | 10% – 33% | 1% – 1% | 20% – 20% | 16% – 20% | 21% – 43% | 0% – 0% | |
Figure 4.113: Range of EU supply mix per configuration, Existing infrastructure level.
| DZ | AZ | LNG | LY | NP | NO | RU | TM | ||
|---|---|---|---|---|---|---|---|---|---|
| 2025 | COAL BEFORE GAS | 5% – 6% | 2% – 3% | 13% – 34% | 1% – 1% | 15% – 15% | 18% – 21% | 23% – 45% | 0% – 0% |
| GAS BEFORE COAL | 5% – 6% | 2% – 3% | 13% – 33% | 1% – 1% | 15% – 15% | 18% – 20% | 23% – 43% | 0% – 0% | |
| 2030 | NATIONAL TRENDS | 4% – 7% | 2% – 3% | 14% – 35% | 1% – 1% | 13% – 13% | 18% – 22% | 22% – 45% | 0% – 0% |
| DISTRIBUTED ENERGY | 5% – 6% | 2% – 3% | 13% – 32% | 1% – 1% | 19% – 19% | 16% – 21% | 20% – 42% | 0% – 0% | |
| GLOBAL AMBITION | 5% – 6% | 2% – 3% | 14% – 32% | 1% – 1% | 15% – 15% | 18% – 20% | 24% – 43% | 0% – 0% | |
| 2040 | NATIONAL TRENDS | 5% – 7% | 2% – 3% | 8% – 36% | 1% – 1% | 13% – 13% | 18% – 21% | 21% – 48% | 0% – 0% |
| DISTRIBUTED ENERGY | 3% – 7% | 3% – 3% | 6% – 33% | 1% – 1% | 28% – 36% | 14% – 22% | 13% – 45% | 0% – 0% | |
| GLOBAL AMBITION | 5% – 7% | 2% – 3% | 7% – 33% | 1% – 1% | 20% – 21% | 16% – 20% | 18% – 44% | 0% – 0% | |
Figure 4.114: Range of EU supply mix per configuration, Low infrastructure level.