2.1From draft to final TYNDP 2020
2.1.1 What has happened since the draft TYNDP publication?
ENTSOG released the draft publication of TYNDP 2020 on 25 November 2020 and launched a public consultation which was opened to 15 January 2021 to continue the focus on stakeholder engagement and continual improvement of the report.
On 16 December, within the public consultation period, ENTSOG hosted a TYNDP Presentation Day open to all stakeholders organised as webinar. This was designed to give a high-level introduction to the TYNDP and its role as part of EU regulation, a summary of the content provided and more insight into the results produced in the 2020 edition. This offered a wide range of stakeholders an open forum where they could ask questions and participate in discussions regarding any aspect of the TYNDP process. The TYNDP Presentation is available on ENTSOG website1.
On 10 February 2021, the draft TYNDP 2020 was submitted to ACER, together with the results of the public consultation, for its Opinion. The Opinion was published on 3 May 2021. It indicates where ACER sees improvements from the previous edition of TYNDP, and provides recommendations for improvement, split between the short and the medium to long-term.
2.1.2 Why a feedback section?
This section aims at gathering the feedback received from both ACER and the stakeholders. It handles what from this feedback could already be addressed in the final TYNDP 2020. Handling of such feedback is covered in the feedback section itself, rather than in the related sections of the TYNDP, to facilitate the overview. For further feedback that could be taken into consideration for future editions of the TYNDP, this section indicates into to which process it will feed.
The section has been structured to first respond to the ACER Opinion, covering both the short-term recommendations relating to TYNDP 2020 and the medium to long-term recommendations for future editions of the TYNDP. This is followed by an analysis of the public consultation.
2.1.3 Review section comparing past assumptions and projections of gas demand and supply and their actually observed levels
From one TYNDP edition to the next, ENTSOG critically review the TYNDP input data, in particular the demand scenarios and supply potentials. For each new TYNDP edition ENTSOG develop elements that are discussed as part of the stakeholder engagement process, and this comparison is a way to better formalise its usual critical review of assumptions.
Supply
Figure 2.1 compares the TYNDP 2020 supply potentials for year 2020 with the actual historical EU imports. For Russia, LNG and Libya those imports have materialised in the range of the potentials as expected in TYNDP 2020. Norway has shown actual imports above expected potential. Algeria has shown actual imports slightly below expected potential.
As part of the TYNDP 2020 process, the supply potentials were amended again to better correlate with the historical EU import. In particular, ENTSOG has used information from the IEA World Energy Outlook. During the stakeholder’s engagement process for TYNDP 2020, the new supply potentials were presented and discussed, resulting in further adjustment of some of the sources.
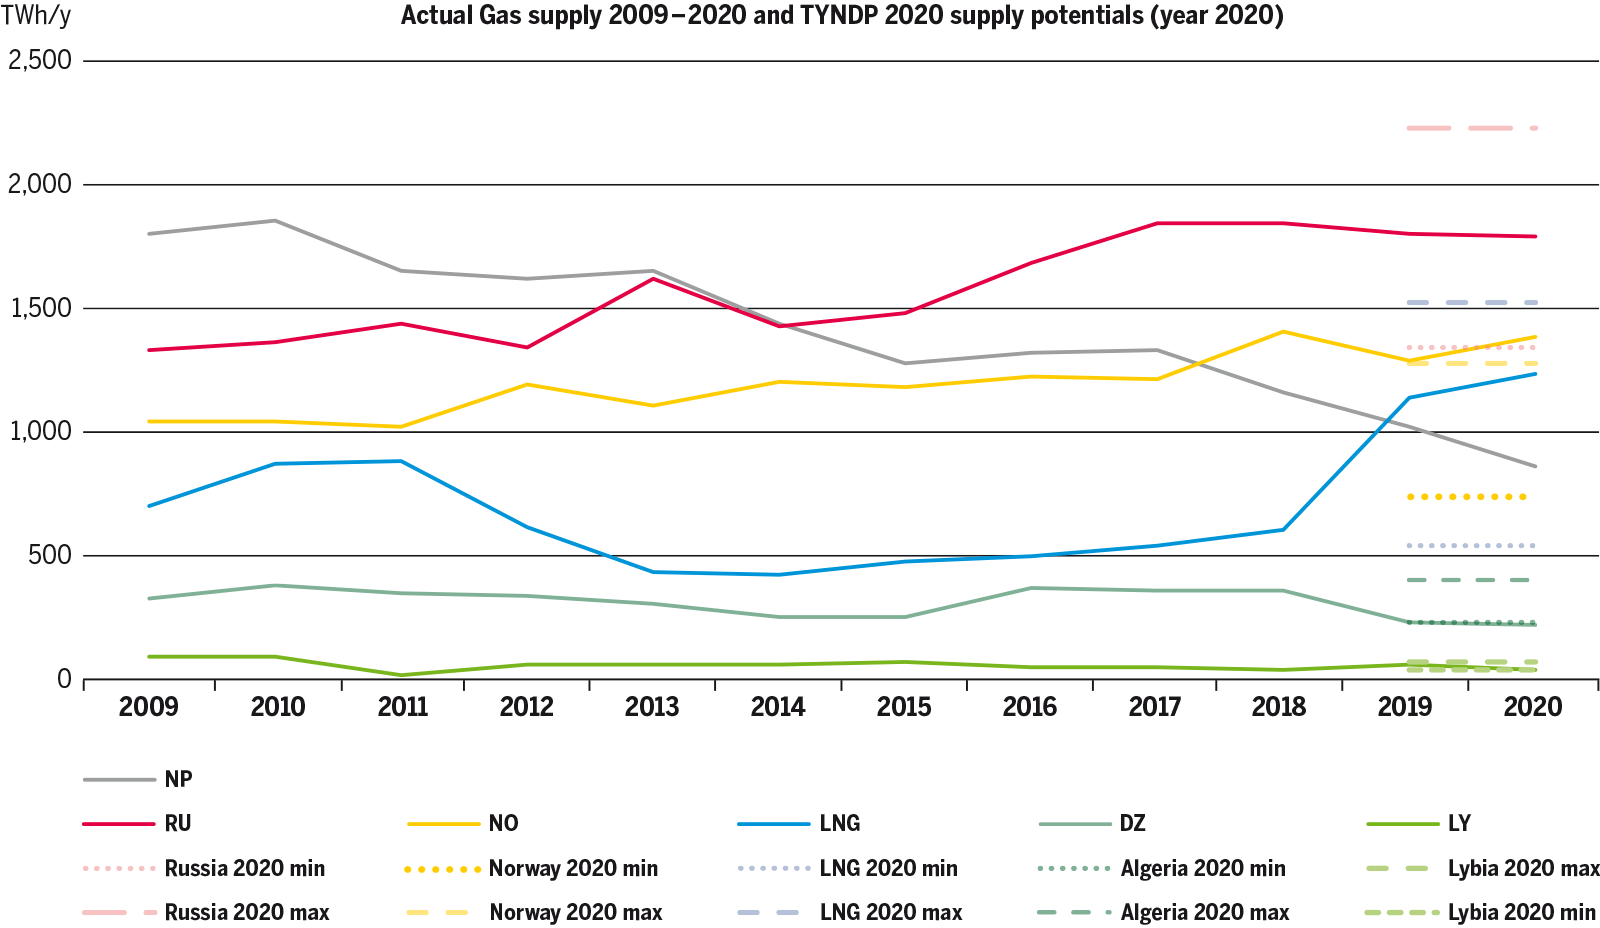
Figure 2.1: Actual Gas supply 2009 – 2020 and TYNDP 2020 supply potentials (year 2020).
Demand
TYNDP 2020 has three scenarios: National Trends, which is developed based on the collection of data from TSOs, and two COP 21 scenarios – Global Ambition and Distributed Energy – which are developed by the scenario building process.
As for TYNDP 2018, total gas demand was made up of Final Gas Demand (defined as Residential & Commercial, Industrial and Transport sectors) and Gas Demand for Power Generation. Gas for power generation for all scenarios was the result of the ENTSO-E modelling results. During the data collection phase, gas and electricity TSO worked together to discuss gas installed capacity on a country level basis. Yearly gas demand for power generation averages is calculated from the average of all approved models across all climate years.
The Best Estimate scenarios for 2020 and 2025 were based on TSO perspective, reflecting all national and European regulations in place, whilst not conflicting with any of the other scenarios. A sensitivity analysis regarding the merit order of coal and gas in the power sector was included for 2025 following stakeholder input regarding the uncertainty on prices, even in the short term.
National Trends is the central policy scenario, designed to reflect the most recent EU Member States’ National Energy and Climate Plans (NECP), submitted to the EC in line with the requirement to meet current European 2030 energy strategy targets.
In addition, ENTSO-E and ENTSOG have created two scenarios in line with the COP21 targets (Distributed Energy and Global Ambition) with the objective to understand the impact on infrastructure needs against different pathways reducing EU-28 emissions to net-zero by 2050.
Global Ambition is a scenario compliant with the 1.5 °C target of the Paris Agreement also considering the EU’s climate targets for 2030. It looks at a future that is led by development in centralised generation. Economies of scale lead to significant cost reductions in emerging technologies such as offshore wind, but also imports of energy from competitive sources are considered as a viable option.
Distributed Energy embraces a de-centralised approach to the energy transition. A key feature of the scenario is the role of the energy consumer (prosumer), who actively participates in the energy market and helps to drive the system’s decarbonisation by investing in small-scale solutions and circular approaches.
Figure 2.2 shows the progression of EU level actual demand, versus the result of the TYNDP 2020 under National Trends, Global Ambition and Distributed Energy scenarios. TYNDP 2017 scenarios were considering lower demand for 2017 than actually observed. In TYNDP 2018 scenarios starts with a lower demand than any of TYNDP 2017 scenarios (in 2020).
It is important to note that the actual demand levels shown reflect the actual weather conditions, whereas data collected for the scenarios represents yearly demand under average climatic conditions.
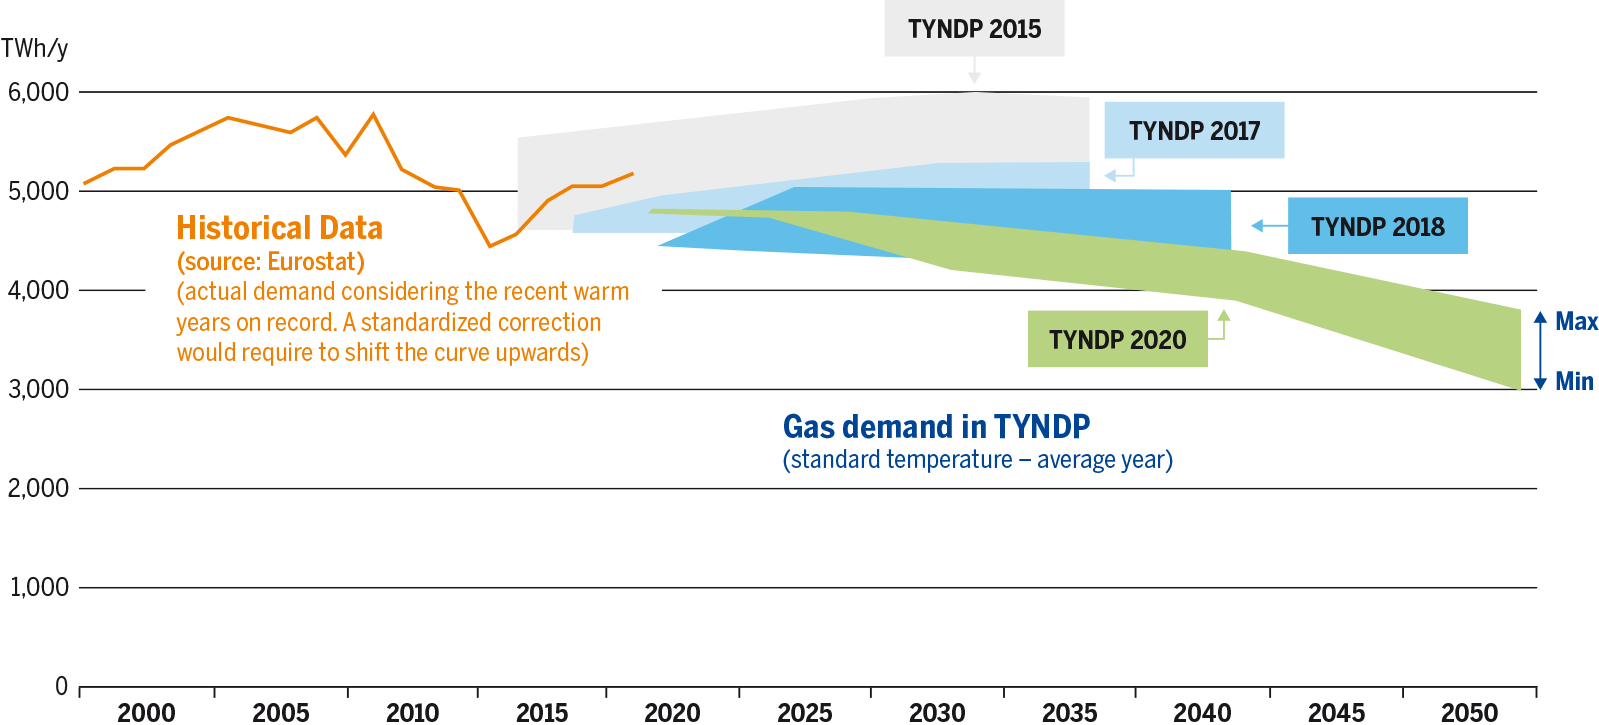
Figure 2.2: Actual EU Gas Demand 2000 – 2020, TYNDP Demand Scenario data.
There was a drop of around 11 % for gas demand between 2013 and 2014, driven by many factors such as low coal and CO₂ prices pushing gas out of the power generation mix, a continuation of the slow economic situation and a significantly warmer than average year, leading to significant reduction in the need for heating.
EU gas demand in 2015 saw a 4 % recovery from the previous year to 4,595 TWh, which can again be linked to a number of factors with sectoral differences at a country level.
During 2016, EU gas demand increased again by 6.7 % to 4,903 TWh. The reduction in gas prices that had started towards the end of 2015 continued into first half of 2016, and although gas prices increased in the final quarter of the year, coal prices increased 68 % compared to same period in 2015 meaning gas competitiveness increased in the power generation market. Power generation analysis has shown a significant coal to gas switch in a number of countries during 2016, linked to the above-mentioned price situation, but this was also influenced by the ongoing Carbon Price Floor2 policy in the UK.
In 2017 further increase in gas demand was observed, reaching 5,077 TWh (+ 3,5 %). Coal to gas switch continues moderately. Gas prices were higher comparing previous year – strong demand of gas for power and storage injections have supported gas price in EU hubs during summer and increase in gas demand in winter.
In 2018 stabilisation in the context of gas demand was observed – 5,080 TWh was reached, meaning that value was comparable to 2017. At the beginning of the year, Europe experienced an extreme cold spell. Gas hub tested to limit on cold snap and prices reached multi-year highs. These circumstances led to declaration of early warning in few European countries and as a consequence of the situation, significant gas withdraw from storages was observed. Later the year, during summer, gas consumption was lower and allowed to fill the gas storages to be prepared in case of any events. Last quarter of 2018 showed decrease of gas demand comparing with the 2017.
2019 has confirmed the role of gas before coal in the power generation merit order and it translated into an increase compared to 2018 – 5,171 TWh. The warm weather in first quarter of the year allowed to enter summer with considerably high gas volumes in storages. Comfortable supply, falling gas prices and flexibility during the first quarter of the year allowed for reaching the very high stock level at the beginning of the winter and moderate usage of gas inventories in the last quarter. In 2019, LNG strengthened its role in supplying Europe.
In TYNDP 2018 all scenarios have been built as realistic and technically sound, based on forward looking policies, whilst also being ambitious in nature and aiming at reducing emissions. For the first time, the ENTSOs for gas and electricity have worked together, using their expertise to provide broadly technically feasible a joint set of scenarios. This uniquely common approach has led to resolutely forward-looking scenarios. This is key to test the need and performance of possible future infrastructure in challenging but realistic situations. Future scenario development processes will seek to enhance and improve gas and electricity interactions, looking for synergies, leading to better sharing of data and cooperation.
Following stakeholders’ request for some continuity in the scenario storylines, TYNDP 2020 scenarios are built based on the TYNDP 2018 scenarios. However, the energy landscape is continuously evolving, and scenarios must keep up with the main drivers and trends influencing the energy system. All scenarios head towards a decarbonised future and have been designed to reduce GHG emissions in line with EU targets for 2030 or the United Nations Climate Change Conference 2015 (COP21) Paris Agreement objective of keeping temperature rise below 1.5 °C.