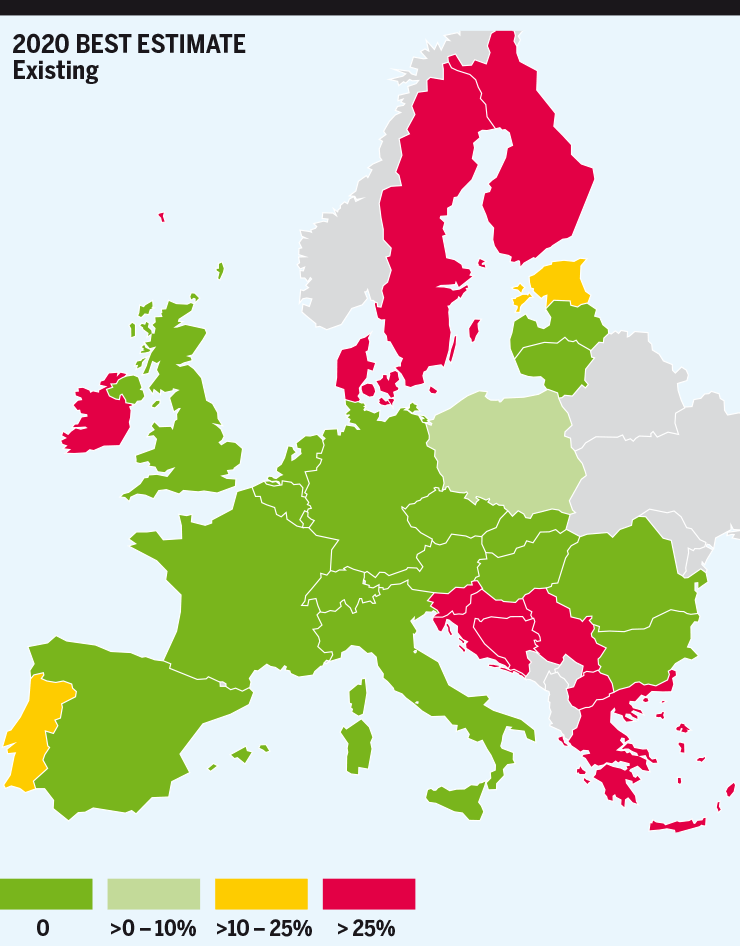
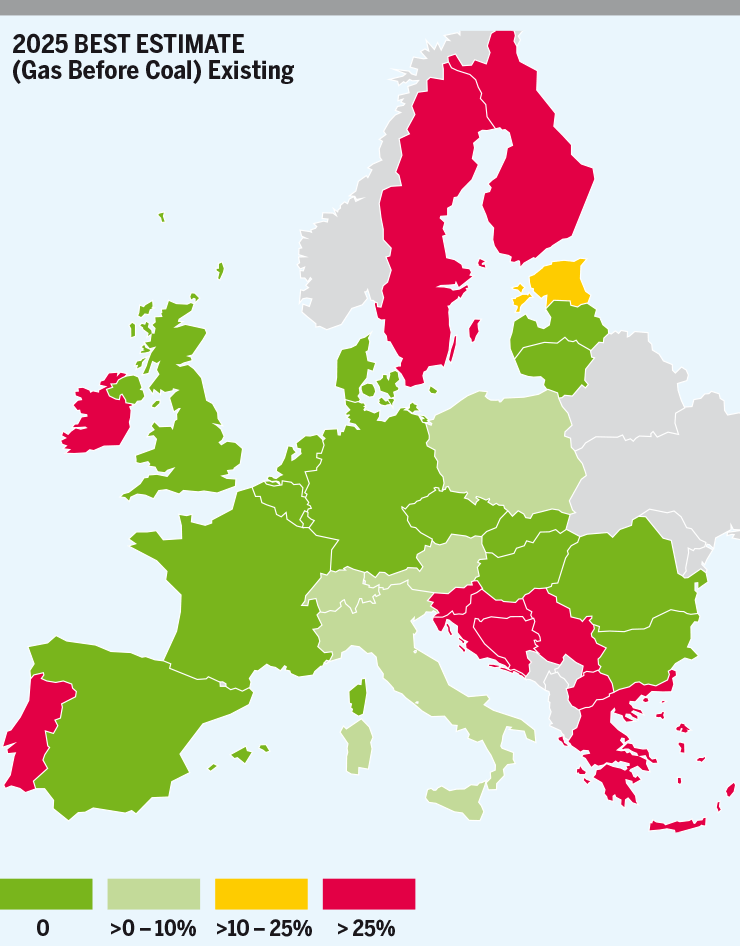
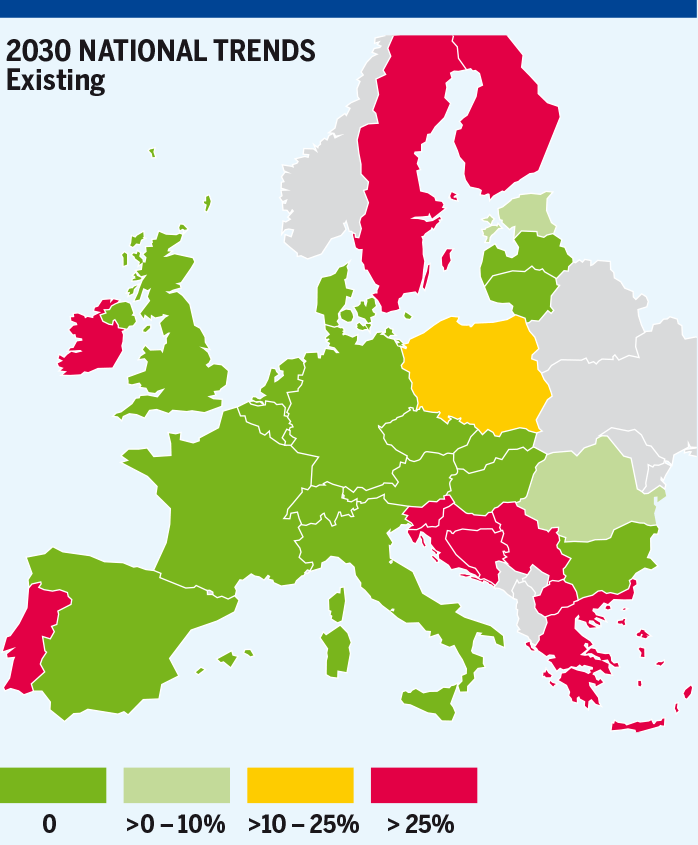
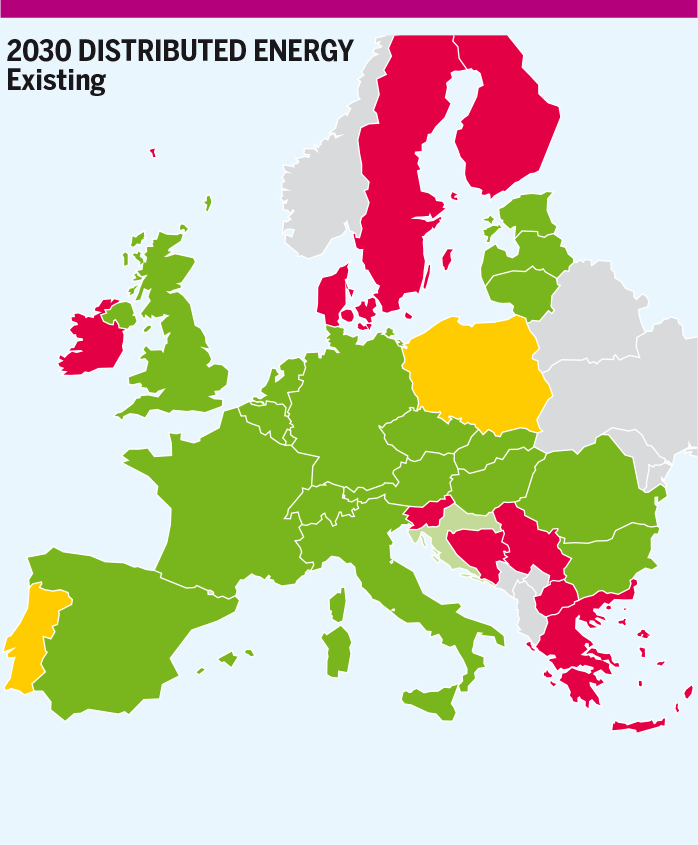
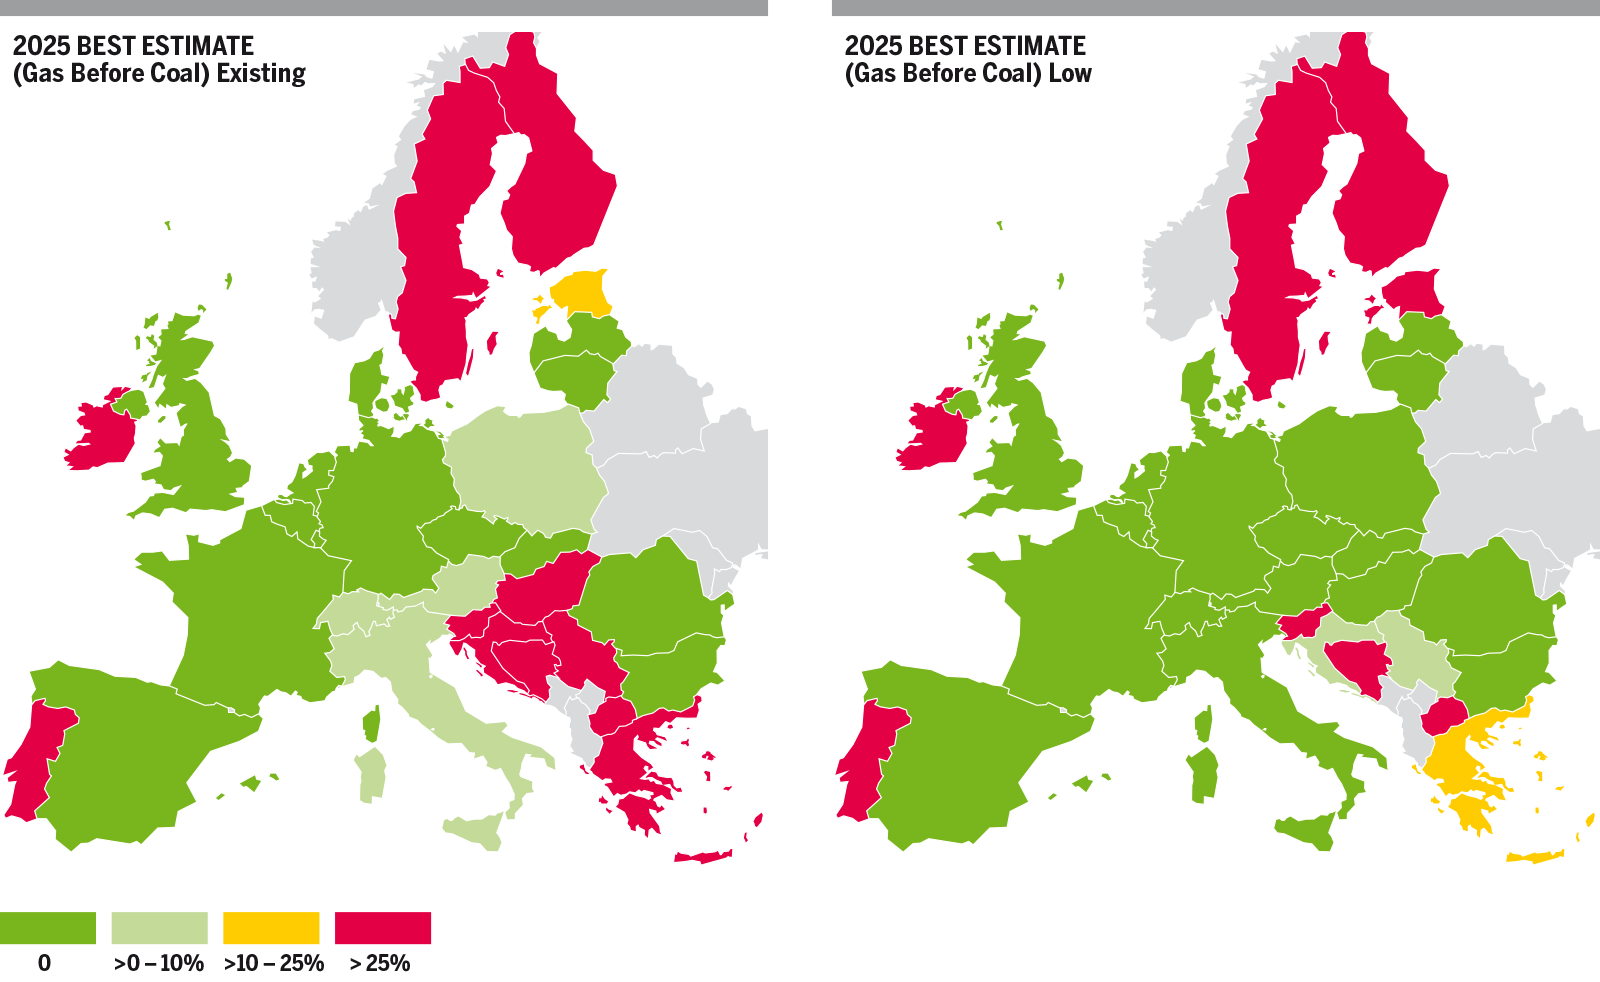
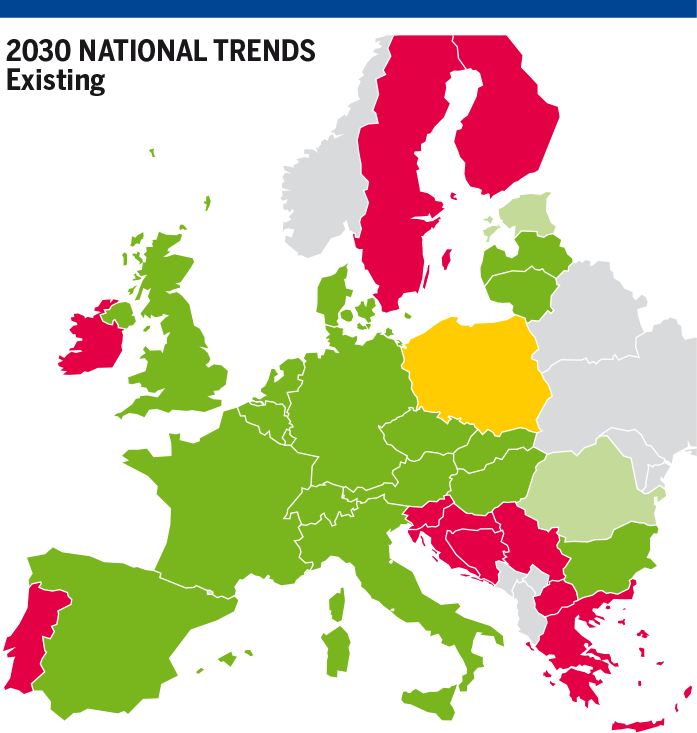
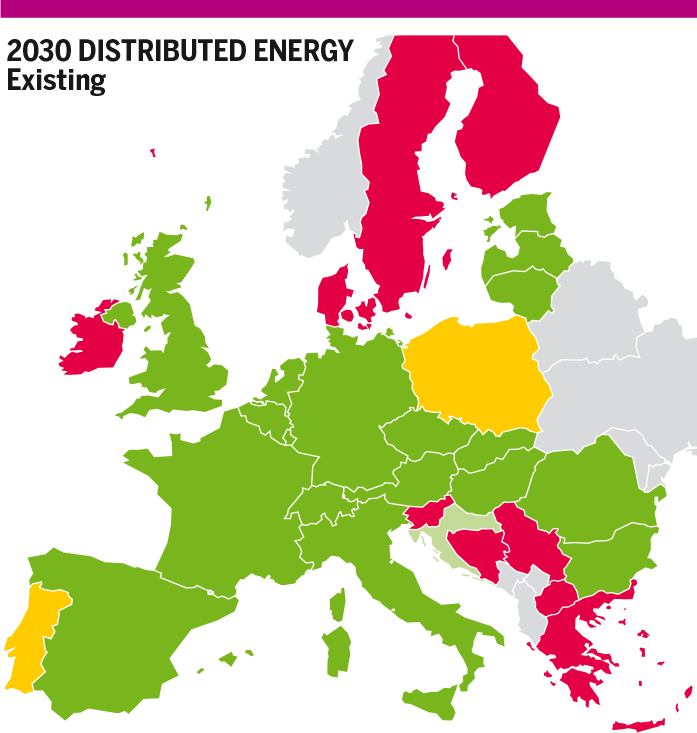
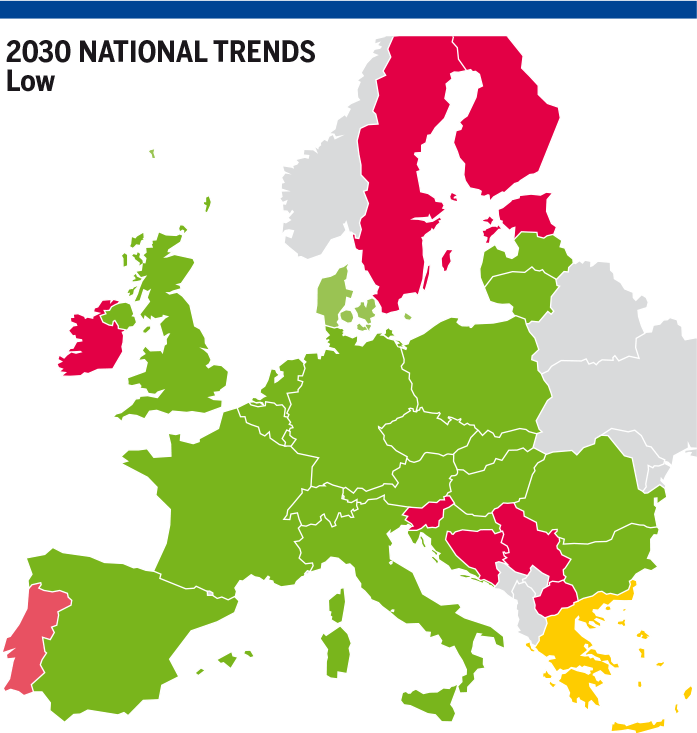
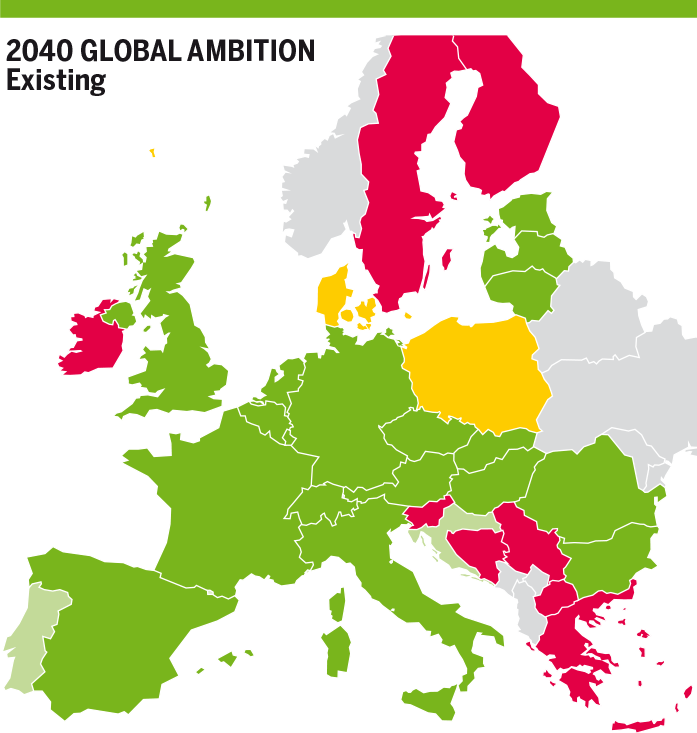
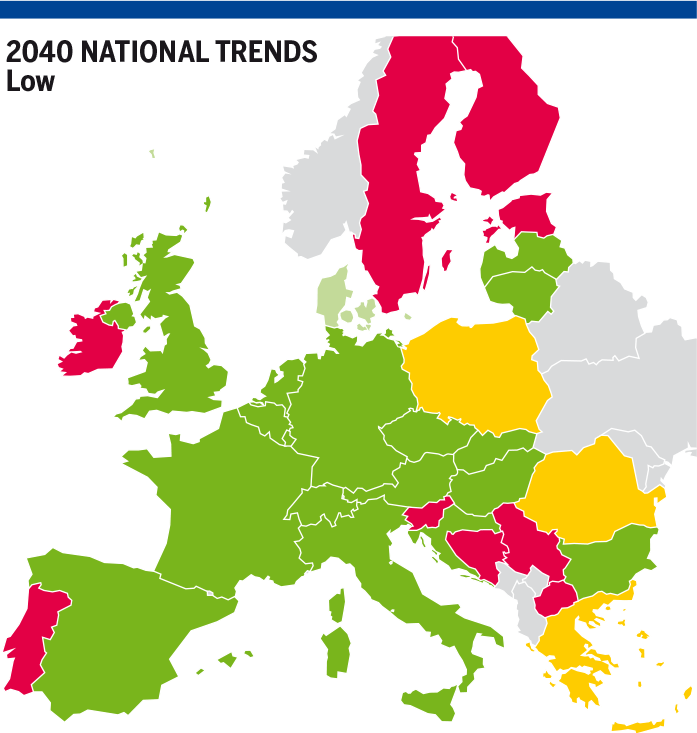
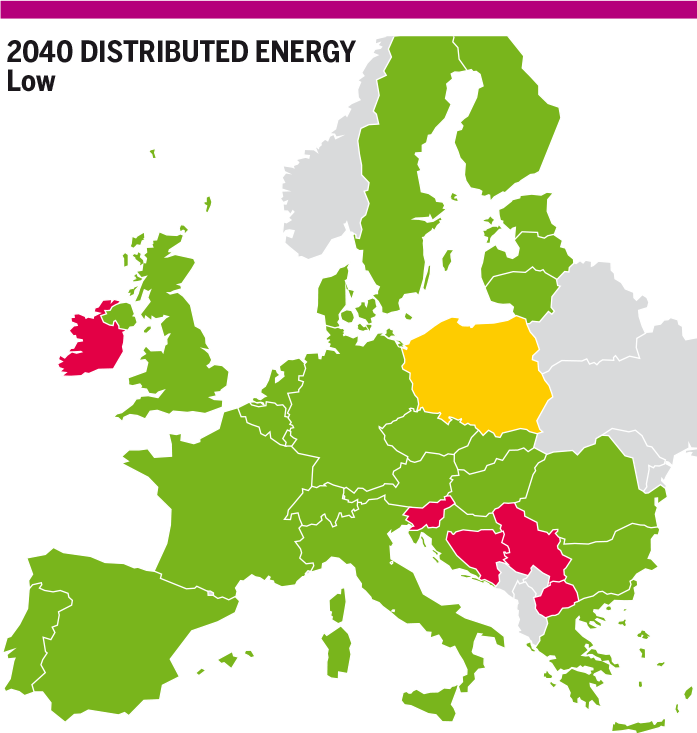
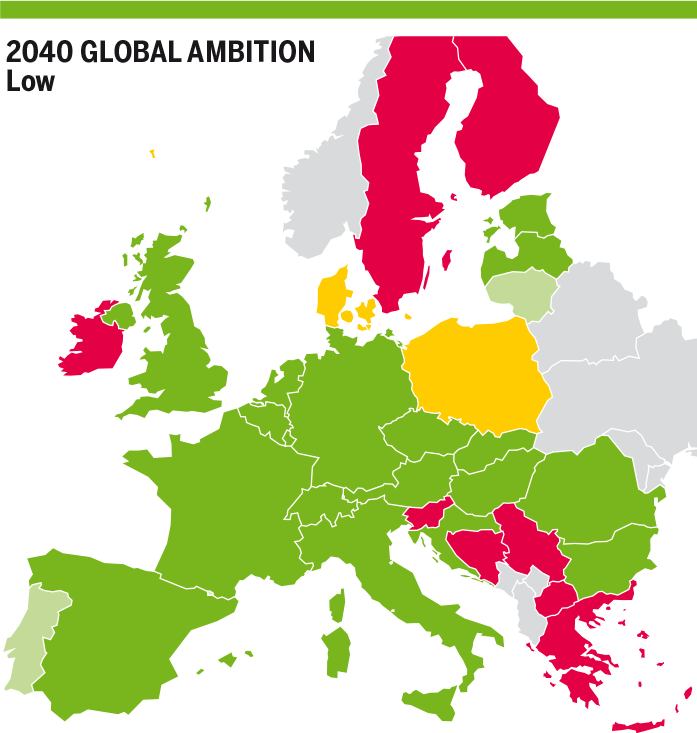
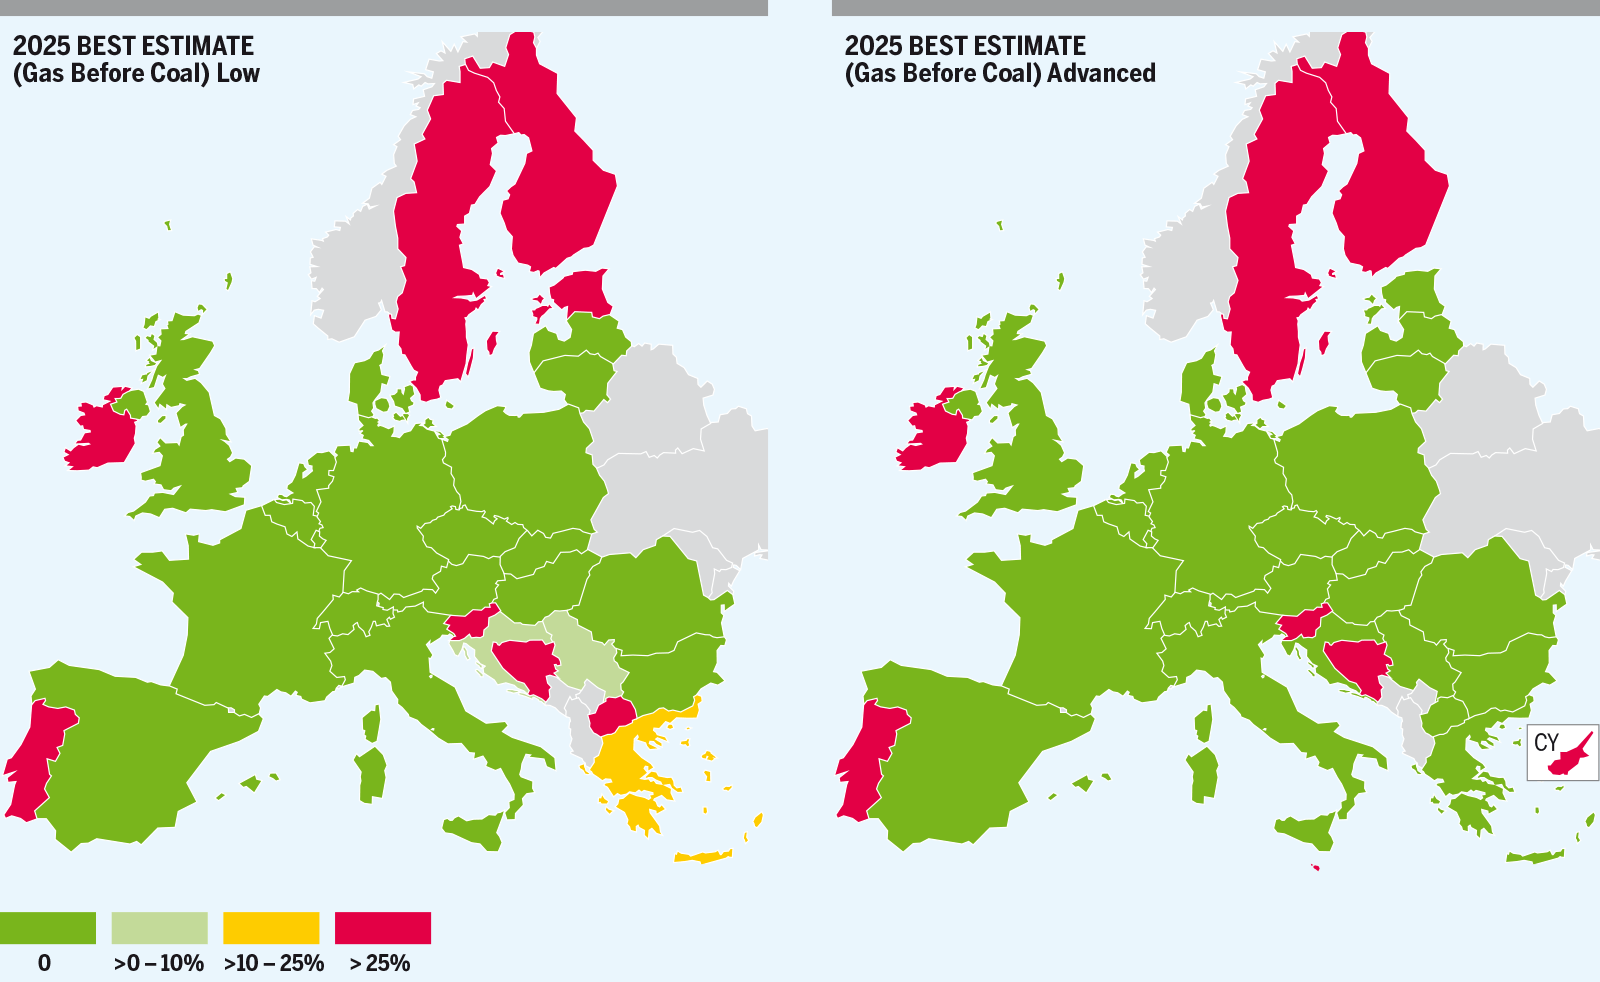
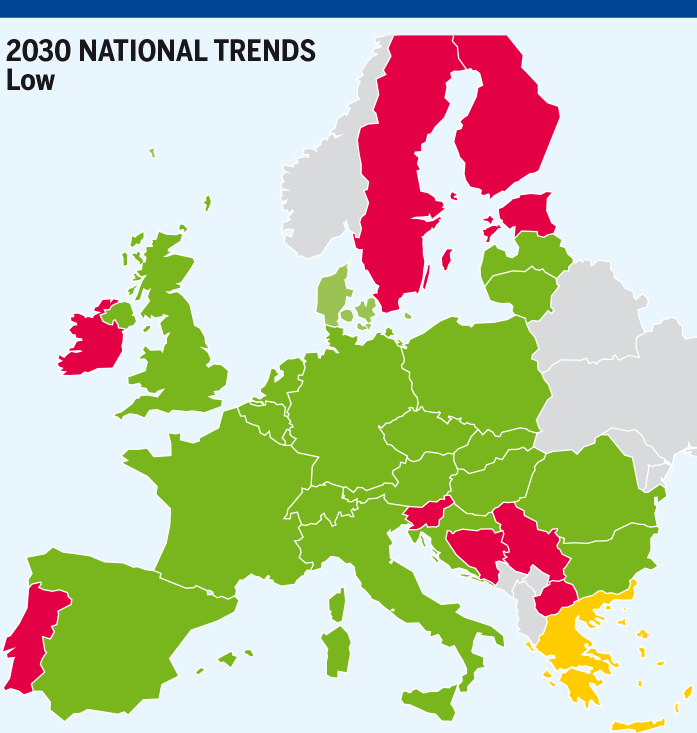
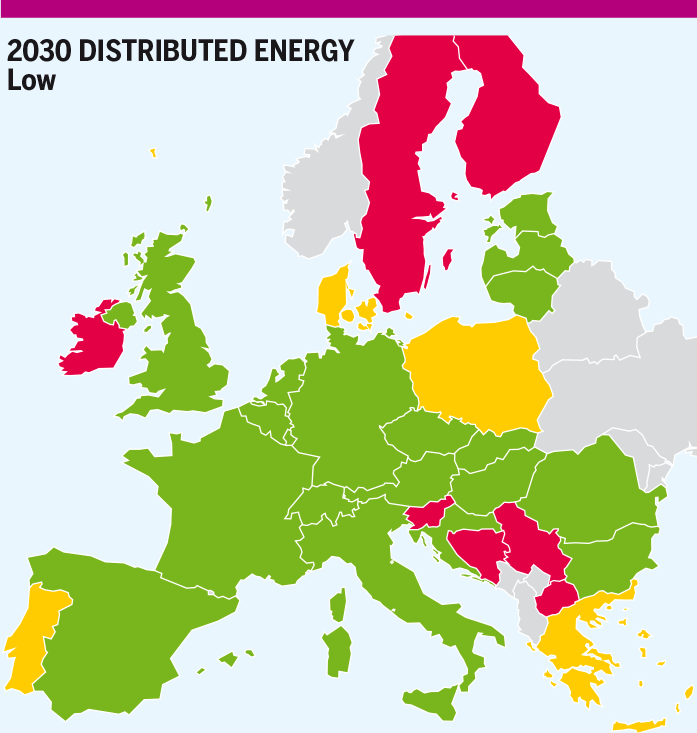
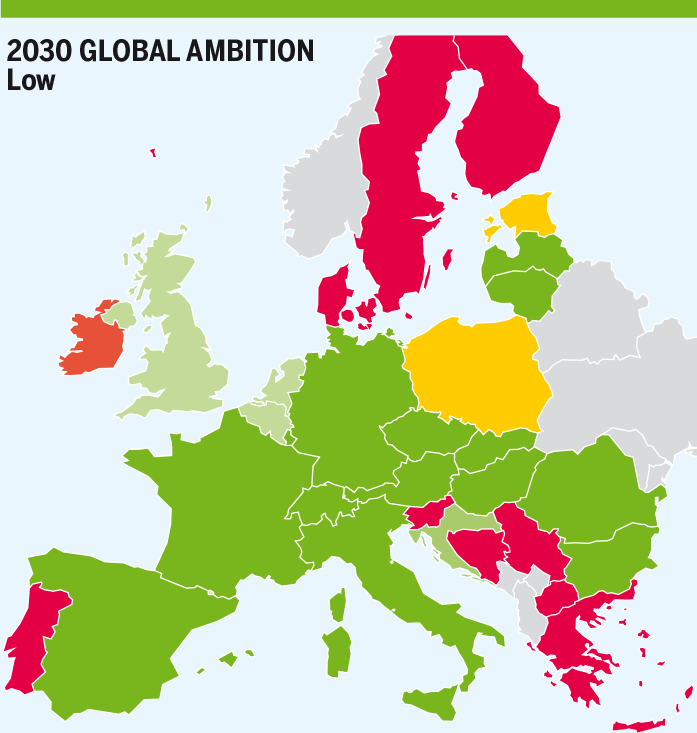
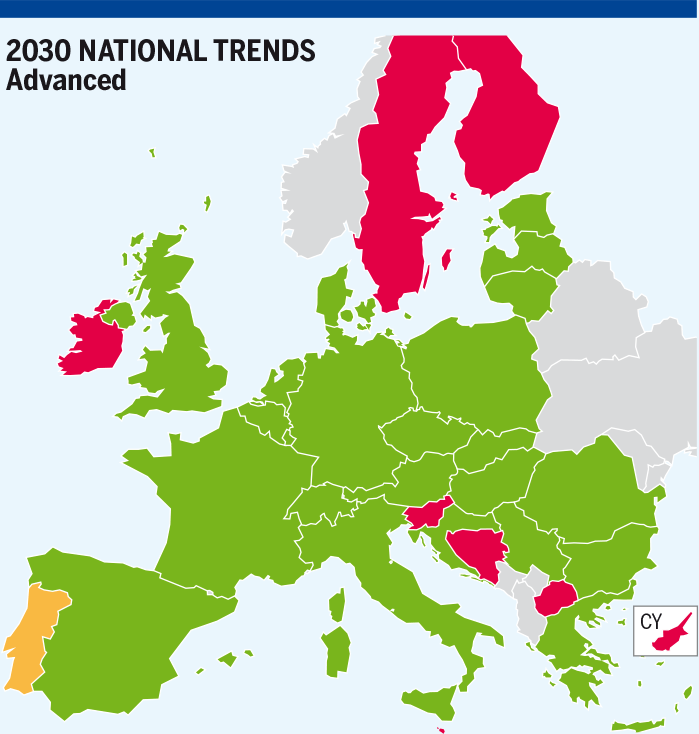
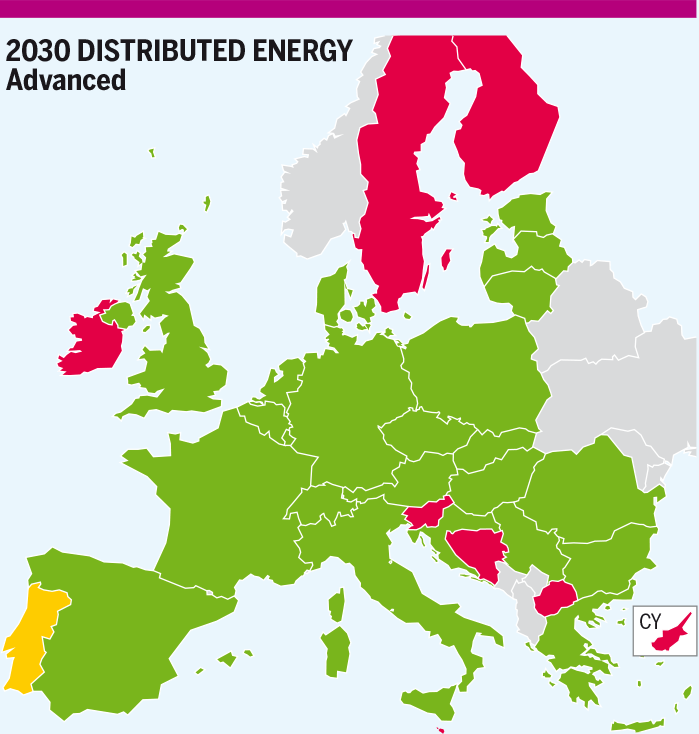
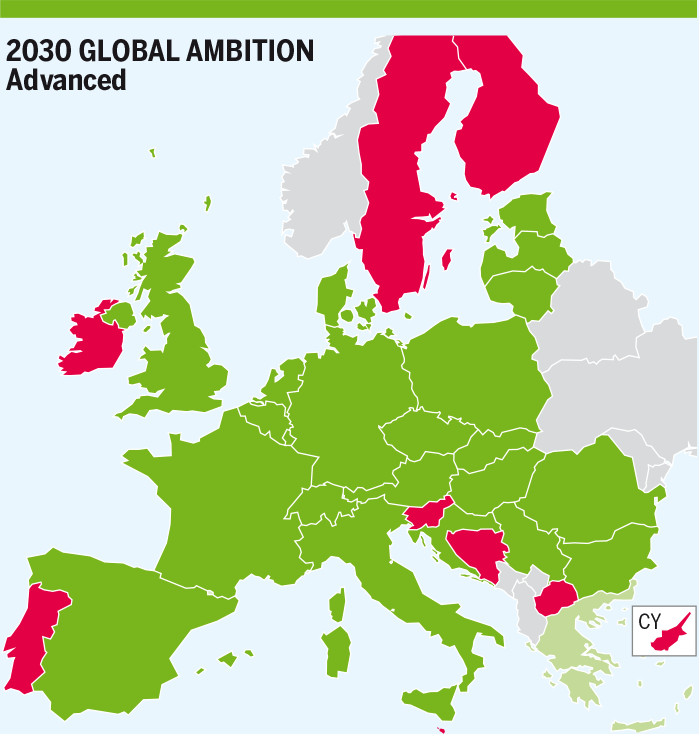
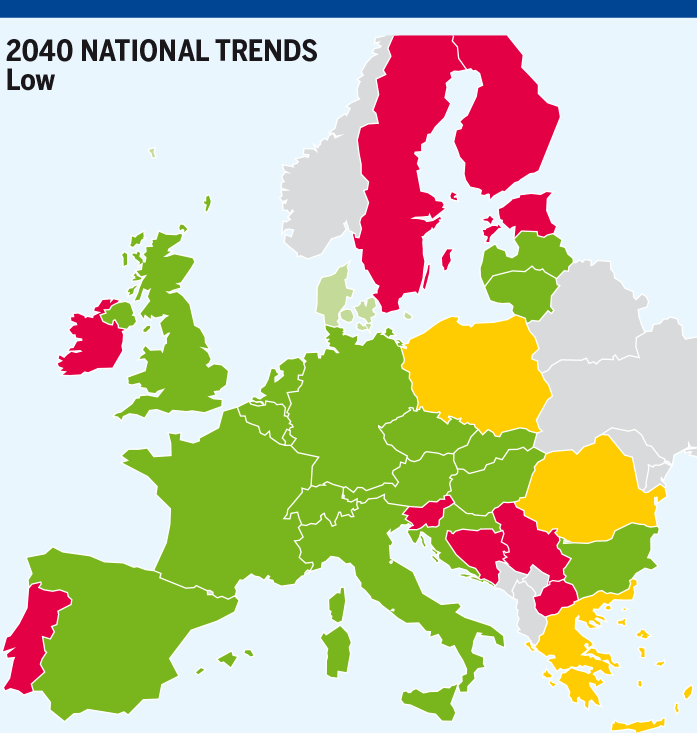
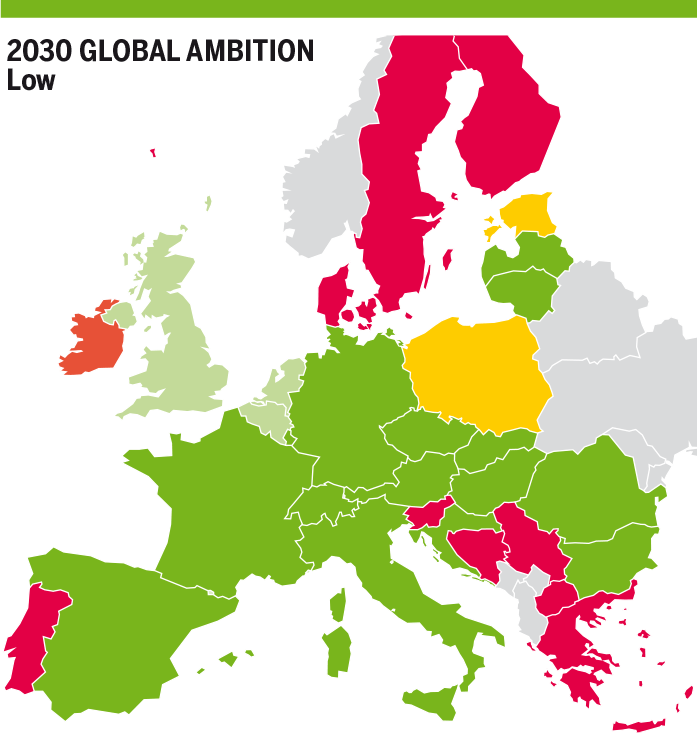
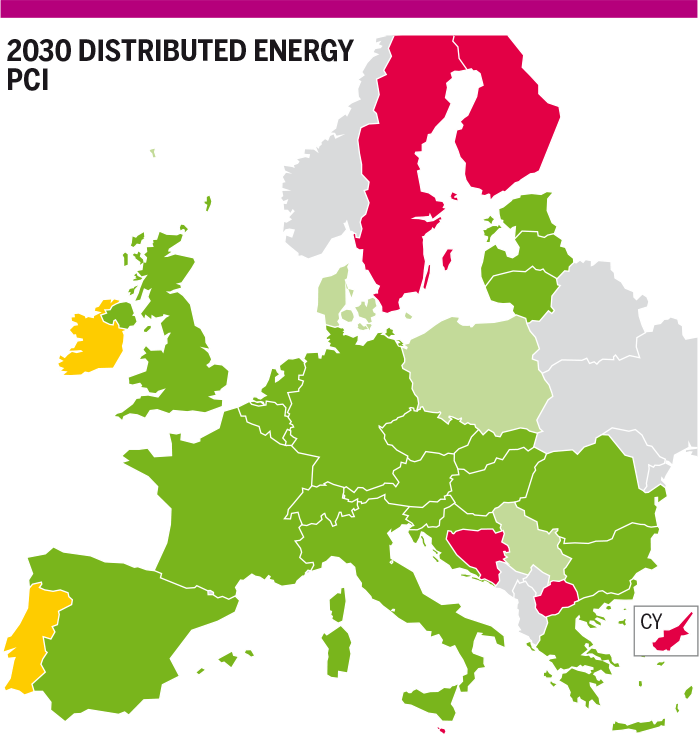
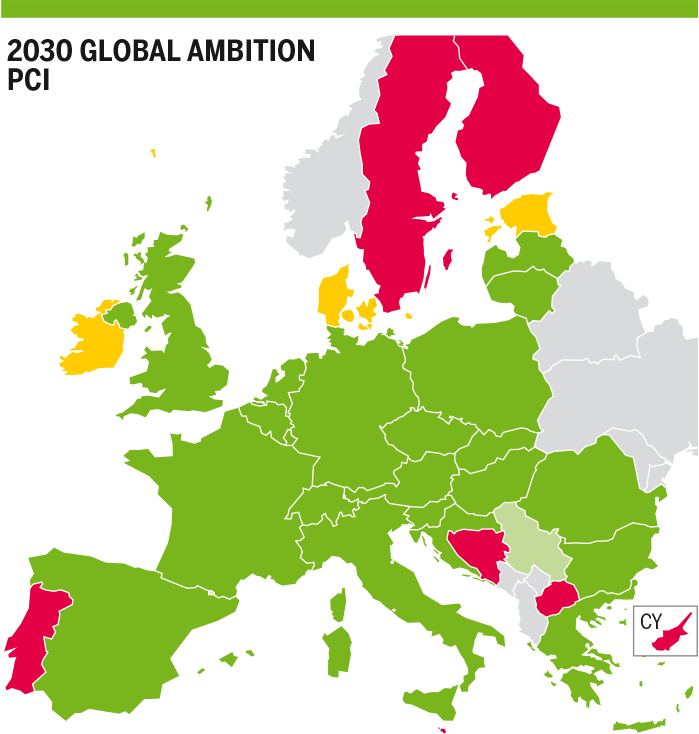
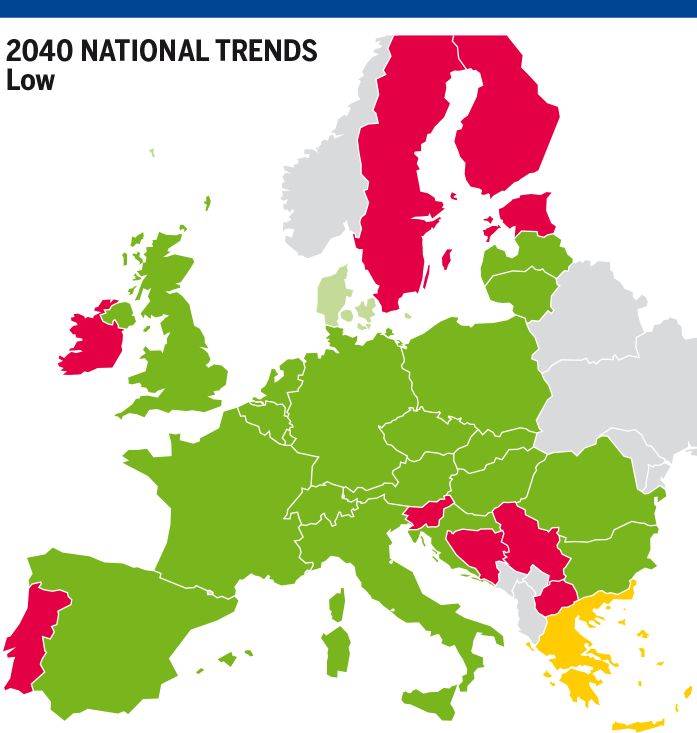
This section investigates the impact of the disruption of the single largest infrastructure of a country during a Peak day. The SLID measures the curtailed demand following the disruption of the single largest interconnection infrastructure in given country (excluding storage and national production).
For each country, the Single Largest Infrastructure depends on the year and the infrastructure level.
The table of Single Largest Infrastructure Disruption and the risk group for each country considered can be found in Annex D.
The results presented below correspond to the possible curtailment demand for a country in case of disruption of its Single Largest Infrastructure and the impact on other countries. The demand curtailment in Peak Day without any disruption are not represented in this chapter (see Climatic Stress chapter).
4.5.1 Existing Infrastructure Level
The existing infrastructure level allows to bring an instructive light on the necessary infrastructure projects in order to mitigate the exposure of the countries to demand curtailment under disruption of the Single Largest Infrastructure.
In general, the existing infrastructure is resilient to most of the disruption of single largest infrastructures. However, some countries at the border of the EU show a potential exposure to significant levels of demand curtailment This exposure is linked to the geographical location limiting the possibility of diversification in terms of interconnection, like in Ireland, Denmark and Sweden, Finland and Greece. Furthermore, in some scenarios in some years, some other countries could be exposed to demand curtailment.
2020
North Eastern Europe
- Denmark is exposed to 40 % demand curtailment as SLID correspond to the interconnection with Germany and limited national production in 2020.
- Sweden is also impacted by SLID in Denmark and is exposed to demand curtailment.
- In case of Swedish SLI (interconnection with Denmark), Sweden is exposed to 90 % of demand curtailment without any other interconnection (low diversification).
- Finland is exposed to demand curtailment (88 %) due to infrastructure limitation with Estonia.
- Estonia is exposed to demand curtailment (18 %) due to infrastructure limitation with neighbouring countries.
- Poland is exposed to a low demand curtailment (4 %) due to infrastructure limitation with neighbouring countries.
Eastern Europe
- Croatia is exposed to a significant risk of demand curtailment (37 %) due to an infrastructure limitation with Slovenia.
- Slovenia is exposed to a significant risk of demand curtailment (37 %) due to an infrastructure limitation with Croatia and Italy.
- Serbia with limited access to different sources (national production and Storage in case of SLI with Hungary) is exposed to 80 % of demand curtailment. Serbia is dependent on its interconnection with Hungary.
- Greece is exposed to 47 % demand curtailment due to infrastructure limitation with neighbouring countries when the larger infrastructure i. e. the LNG terminal is disrupted.
- Bosnia and Herzegovina and North Macedonia have only one interconnection and are exposed to 100 % demand curtailment in case of their SLID respectively.
Western Europe
- Ireland is exposed to demand curtailment (71 %) due to not enough interconnections in case of Moffat disruption (connection with UK). In the same time, Northern Ireland which depends totally of Moffat interconnection is also exposed to 100 % demand curtailment.
- Portugal is exposed to a relatively low demand curtailment (12 %) due to infrastructure limitation with the Spain-Portugal interconnection (Single Largest Infrastructure disrupted in Portugal is Sines Terminal).
2025
North Eastern Europe
- In case of SLID Denmark, Denmark fully mitigates risk of demand curtailment with high conventional gas production and Sweden is no longer exposed to any risk.
- Sweden, in case of Swedish SLID, is exposed to 71 % of demand curtailment, thanks to the increase in national production.
- Finland and Estonia are still exposed to risks of demand curtailment.
- Poland with high demand scenario for power generation is more exposed to demand curtailment and show infrastructure limitation for all its interconnections (SLI-Poland is Yamal interconnection).
Eastern Europe
- Croatia is exposed to a significant risk of demand curtailment (37 %) due to an infrastructure limitation with Slovenia.
- Slovenia is exposed to a significant risk of demand curtailment (53 %) due to an infrastructure limitation with Croatia and Italy and high demand for power.
- Serbia with limited access to different sources (national production and storage in case of SLI with Hungary) is exposed to 67 % of demand curtailment. Serbia is dependent on its interconnection with Hungary.
- Greece is exposed to 46 % demand curtailment due to infrastructure limitation with neighbouring countries.
- Bosnia and Herzegovina and North Macedonia have only one interconnection and are exposed to 100 % demand curtailment in case of their SLID respectively.
Western Europe
- Ireland is exposed to demand curtailment (84 %) due to not enough interconnections in case of Moffat disruption (connection with UK) and low indigenous production. In the same time, Northern Ireland which depends totally on Moffat interconnection is also exposed to 100 % demand curtailment.
- Portugal is exposed to demand curtailment (35 %) due to infrastructure limitation with the Spain-Portugal interconnection and high demand scenario.
- In case of SLID in Austria, Austria is exposed to a slight risk of demand curtailment (2 %) and Italy is cooperating and is exposed to a risk of demand curtailment too.
2030
North Eastern Europe
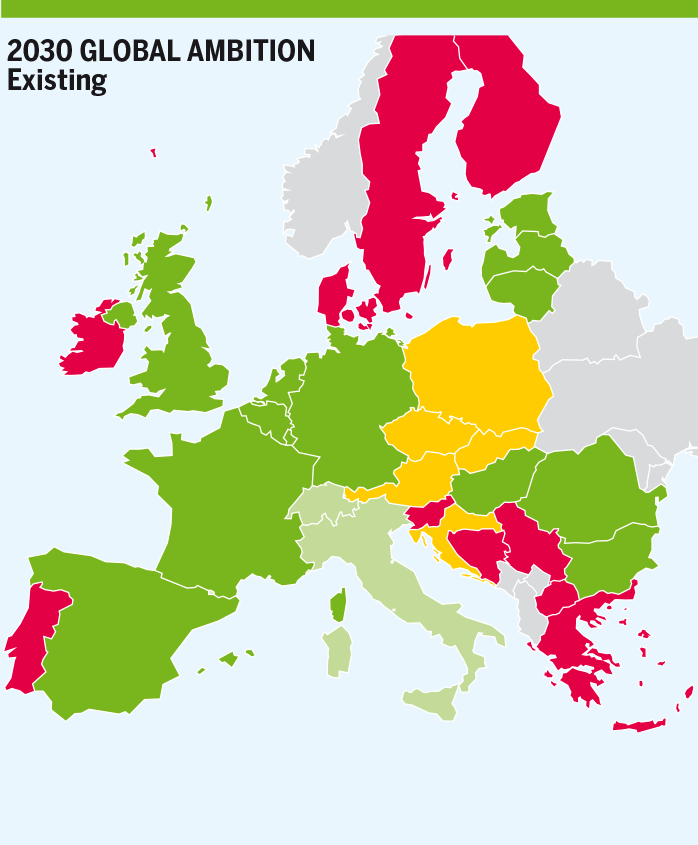
- Denmark is exposed to a risk of demand curtailment (27 %) in Distributed Energy scenario and to higher risk (36 %) in Global Ambition Scenario due high demand scenario for power generation compared to National Trends scenario (risk is fully mitigated) where demand is lower because of low power generation demand and high conventional gas production. Sweden is still exposed to demand curtailment in Distributed Energy scenario only (highest demand scenario).
- Sweden, in case of Sweden SLID, the situation is improving in National Trends scenario due to low demand scenario (low demand for power generation) and in Distributed Energy scenario for which the increase in indigenous production is not sufficient to compensate the high demand for power.
- Finland is exposed to high demand curtailment with a slight improvement compared to 2025 in National Trends scenario due to low demand for power. For the other scenarios, the high indigenous production is not enough to compensate the high demand for power and the demand curtailment is still high (70 %).
- Estonia is exposed to a risk of demand curtailment in National Trends scenario due to high demand for power compared to other scenarios.
- Poland is in a similar position with higher demand curtailment in Global Ambition and National Trends scenarios (15 %) and demand curtailment comparable with 2025 (11 %).
- In case of SLID in Slovakia, Slovakia is exposed to a significant risk of demand curtailment (24 %) and in the same time, neighbouring countries as Austria and Czech Republic are also exposed to the same risk (24 %) due to cooperation mode between neighbouring countries.
Eastern Europe
- Croatia is exposed to a significant risk of demand curtailment (35 %) due to an infrastructure limitation with Slovenia in National Trends scenario. The risk still exists (16 %) in Global Ambition scenario where the indigenous production is not enough to compensate high demand for power generation. The risk is mitigated (8 %) in Distributed Energy due to low demand specially for power and high indigenous production.
- Slovenia is exposed to a significant risk of demand curtailment (53 %) due to an infrastructure limitation with Croatia and Italy and high demand for power in Global Ambition and National Trends scenarios. The situation is mitigated (40 %) in Distributed Energy where indigenous production is compensating partially high demand for power.
- Serbia with limited access to different sources (national production and storage in case of SLI with Hungary) is exposed to 88 % of demand curtailment. Serbia is dependent on its interconnection with Hungary.
- Greece is exposed to 42 % demand curtailment due to infrastructure limitation with neighbouring countries in Global Ambition scenario. The situation is mitigated (43 and 47 %) in Distributed Energy scenario where indigenous production is compensating partially high demand for power and in National Trends scenario with the lowest demand value.
- Bosnia and Herzegovina and North Macedonia have only one interconnection and are exposed to 100 % demand curtailment in case of their SLID respectively.
- Romania is exposed to a slight risk of demand curtailment (5 %) in National Trends scenario due to high demand for power and the lowest national production scenario.
Western Europe
- Ireland is exposed to Demand curtailment (90 %) due to not enough interconnections in case of Moffat disruption (connection with UK) and an indigenous production which does not compensate demand and specially demand for power. In the same time, Northern Ireland which depends totally of Moffat interconnection is also exposed to 100 % demand curtailment.
- Portugal is exposed to demand curtailment (25 %) due to infrastructure limitation with the Spain-Portugal interconnection and high demand scenario in Global Ambition scenario. In National Trends scenario, the demand curtailment reaches 34 % due to high demand for power and 16 % in Distributed Energy with high indigenous production.
- In case of SLID in Austria, Austria is exposed to a slight risk of demand curtailment (2 %) in Global Ambition scenario and Italy is cooperating and might be exposed to a marginal risk of demand curtailment too.
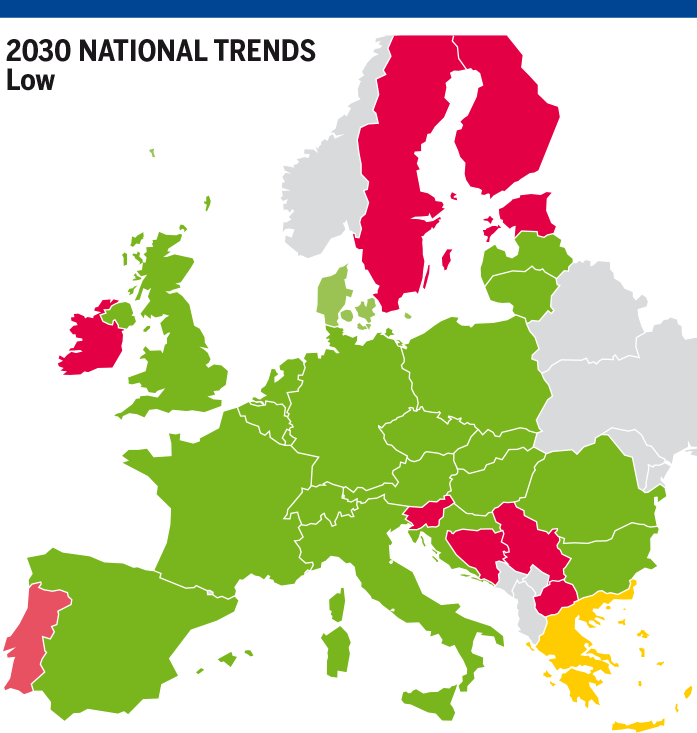
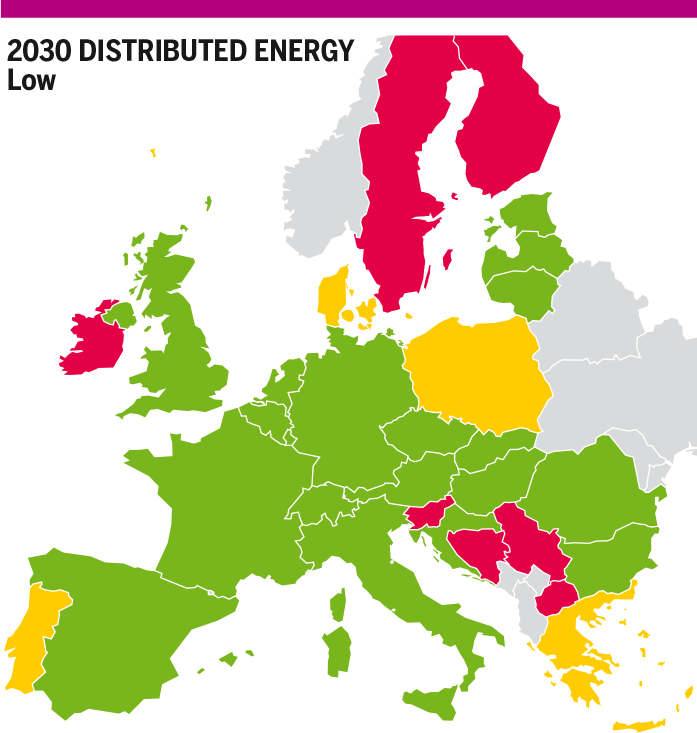
Figure 4.117: Maximum exposure to demand curtailment in case of SLID in Existing Infrastructure level in 2030 for all scenarios.
2040
North Eastern Europe
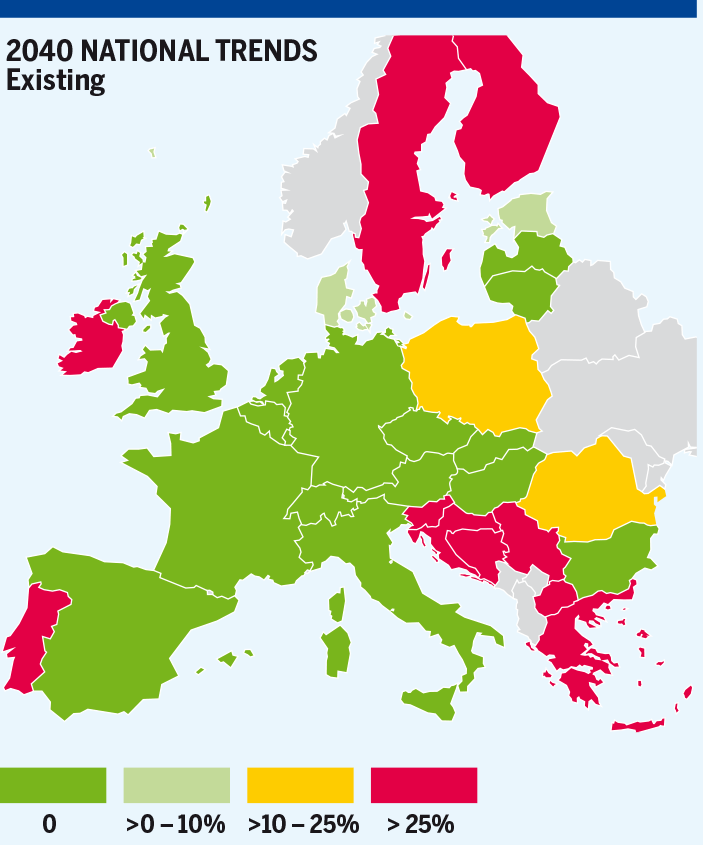
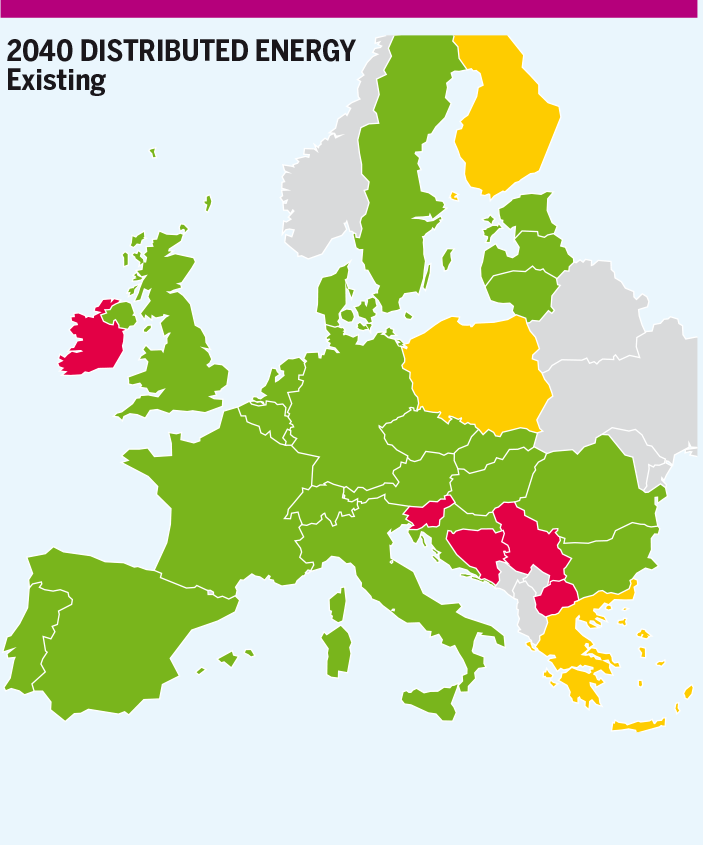
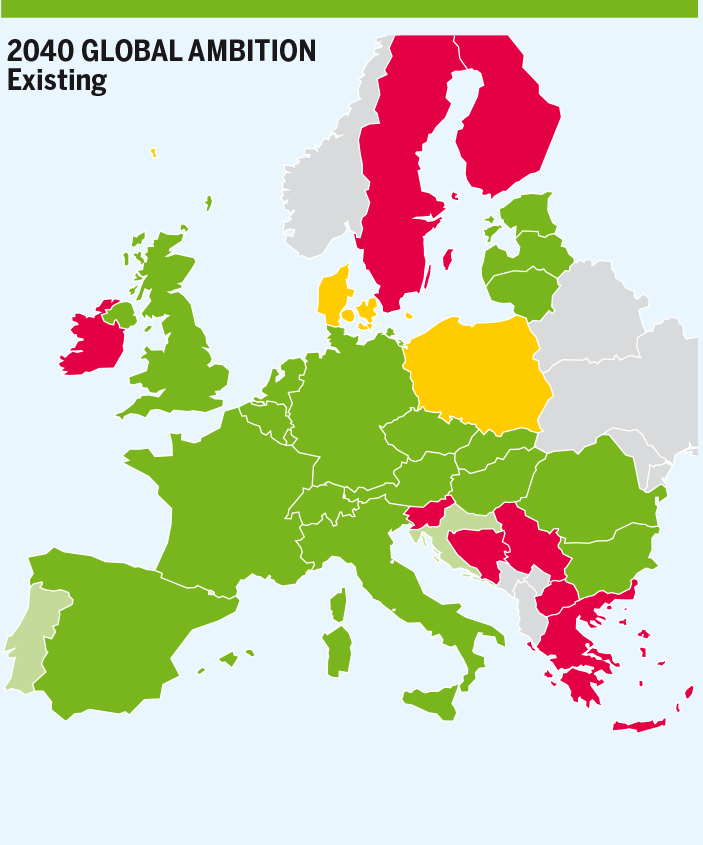
- In case of SLID Denmark, Denmark and Sweden fully mitigate risk of demand curtailment in Distributed Energy scenario with high indigenous production which compensates high demand for power. In Global Ambition scenario the situation is mitigated but still persist with demand curtailment around 24 % in Denmark, 53 % in Sweden (High demand for power but low indigenous production). In National Trends scenario, Denmark mitigates risk of demand curtailment with Indigenous production compare to Sweden which is still exposed to risk of demand curtailment (54 % in Sweden).
- Indigenous production in Distributed Energy scenario mitigates risk of demand curtailment in Finland. In Global Ambition and National Trends scenarios, the risk of demand curtailment is still high (51 and 81 %) due to an infrastructure limitation with Estonia not compensated with indigenous production.
- Poland is exposed to demand curtailment in all scenarios. Indigenous production is not enough to compensate the high demand for power in National Trends (17 %) compared to the other scenario (12 % in Distributed Energy and in Global Ambition).
Eastern Europe
- Croatia is exposed to a significant risk of demand curtailment (35 %) due to an infrastructure limitation with Slovenia in National Trends scenario. The risk is higher compared to 2030 due to low indigenous production. The risk still exists but slightly (7 %) in Global Ambition scenario where the indigenous production is not enough to compensate high demand for power generation. The risk is fully mitigated in Distributed Energy due to low demand specially for power and high indigenous production.
- Slovenia is exposed to a significant risk of demand curtailment (50 %) due to an infrastructure limitation with Croatia and Italy and high demand for power in Global Ambition and National Trends scenarios. The situation is mitigated (32 %) in Distributed Energy where indigenous production is compensating partially high demand for power.
- Serbia with limited access to different sources (national production and storage in case of SLI with Hungary) is exposed to 90 % of demand curtailment. Serbia is dependent on its interconnection with Hungary.
- Greece is exposed to a risk of 46 % demand curtailment due to infrastructure limitation with neighbouring countries in Global Ambition and National Trends scenarios. The situation is mitigated (13 %) in Distributed Energy where demand is compensated partially by indigenous production.
- Bosnia and Herzegovina and North Macedonia have only one interconnection and are exposed to 100 % demand curtailment in case of their SLID.
Western Europe
- Ireland is exposed to Demand curtailment (80 %) due to not enough interconnections in case of Moffat disruption (connection with UK) and an indigenous production which does not compensate demand and specially demand for power. In the same time, Northern Ireland which depends totally of Moffat interconnection is also exposed to 100 % demand curtailment.
- Portugal is exposed to demand curtailment (29 %) due to infrastructure limitation with the Spain-Portugal interconnection, high demand scenario and low indigenous production in National Trends scenario. Demand curtailment is mitigated in Global Ambition scenario with 8 % and fully mitigated in Distributed Energy with demand scenarios compensated partially by high indigenous production.
Figure 4.118: Maximum exposure to demand curtailment in case of SLID in Existing Infrastructure level in 2040 for all scenarios.
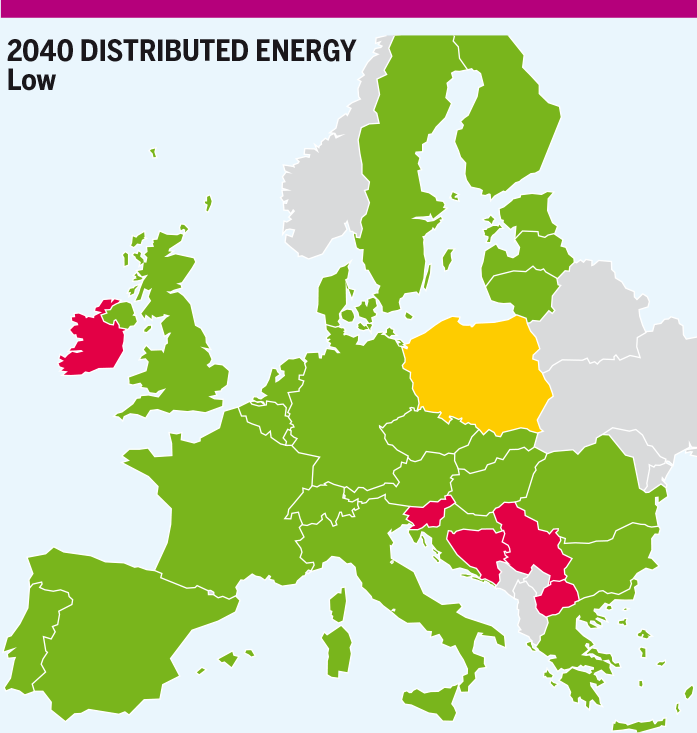
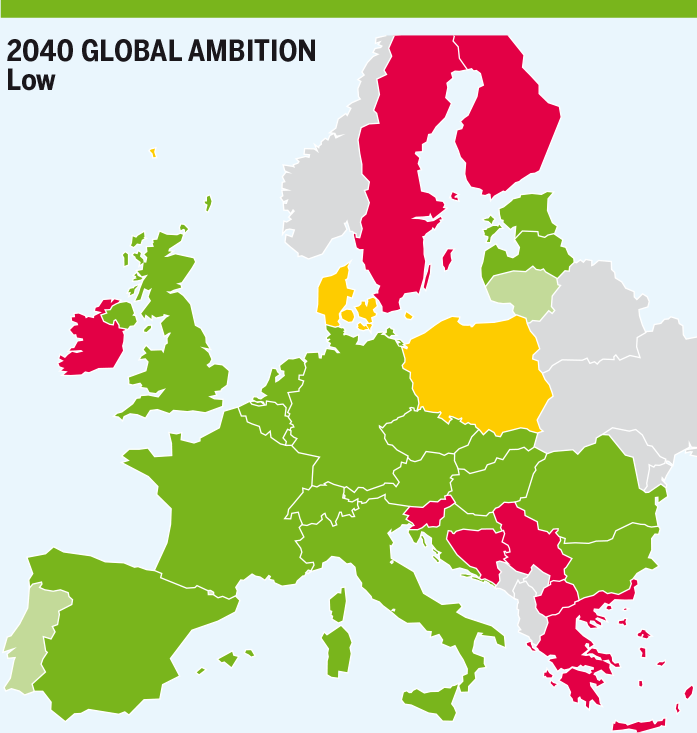
4.5.2 Low Infrastructure Level
The results of the indicator in Low infrastructure level allows to bring an instructive light on the impact of FID projects and the necessary infrastructure projects still needed in order to reduce or even eliminate all risks of demand curtailment under disruption of the Single Largest Infrastructure. FID projects generally improve the resilience of the gas infrastructure but do not fully mitigate the exposure to demand curtailment in case of disruption of some Single Largest Infrastructures.
2025
North Eastern Europe
- Finland mitigates risk of demand curtailment (65 %) thanks Baltic Connector increase capacity from Estonia. In this case, Estonia cooperates more with Finland and is now exposed to high demand curtailment (45 %).
- Poland fully mitigated risk of demand curtailment thanks to Slovakia and Lithuania new interconnections.
- Sweden situation is unchanged without any project improving its source of supply.
Eastern Europe
- FID project in Croatia (LNG terminal KRK) is new Single Largest Infrastructure. Croatia fully mitigates risk of demand curtailment in particular with the existing interconnection from Hungary.
- Greece mitigates its risk of demand curtailment thanks to the Trans Adriatic Pipeline interconnection. Nevertheless, all the interconnections with neighbouring countries are showing infrastructure limitations which do not allow Greece to have access to more gas.
- Slovenia situation is unchanged without any project improving its diversification.
- Bosnia and Herzegovina and North Macedonia situations are unchanged with 100 % risk of demand curtailment.
- Serbia mitigates risk of demand curtailment (8 %) with new interconnections with Bulgaria and Trans Balkan Pipeline.
Western Europe
- The situation is unchanged for Portugal, Ireland, and Northern Ireland.
2030
North Eastern Europe
- The situation is unchanged for Denmark and Sweden.
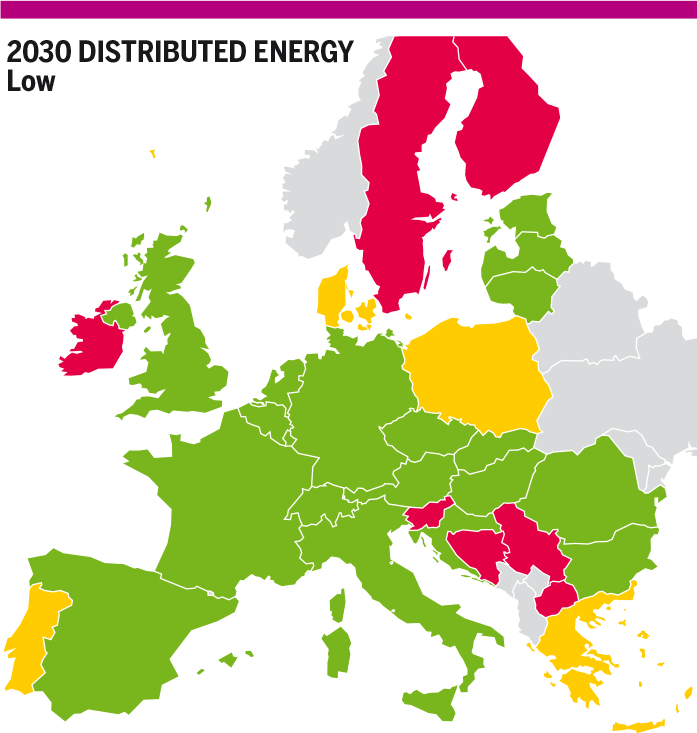
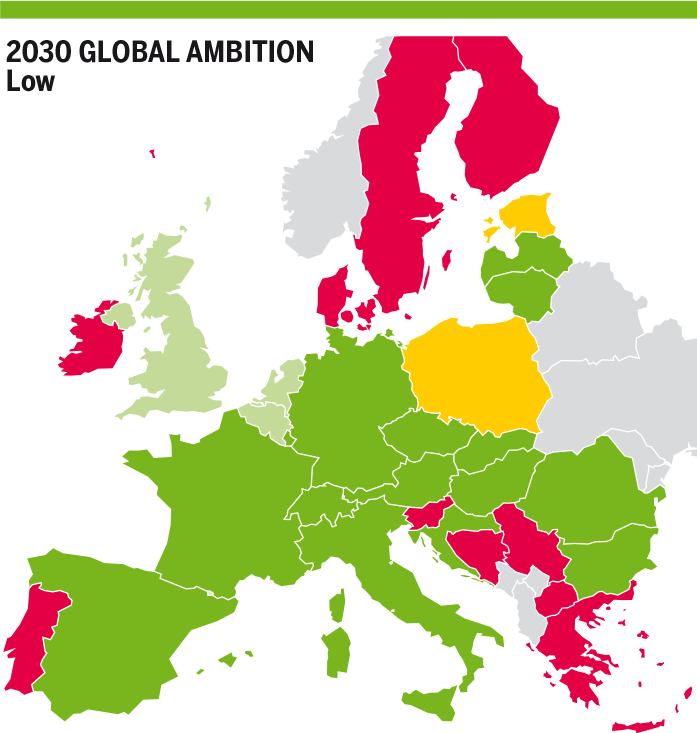
- Finland mitigates risk of demand curtailment thanks to Baltic Connector increased capacity from Estonia. In this case, Estonia cooperates more with Finland and is more exposed to demand curtailment in National trend and Global Ambition scenarios only. In Distributed Energy scenario, indigenous production is enough to satisfy demand and increase flow to Finland.
- Poland fully mitigates risk of demand curtailment in National Trends scenario and mitigates risk of demand curtailment in Distributed Energy and Global Ambition scenarios (14 and 15 % respectively) thanks to Slovakia and Lithuania new interconnections.
Western Europe
- The situation is unchanged for Portugal, Ireland and Northern Ireland.
Eastern Europe
- Greece mitigates its risk of demand curtailment thanks to the Trans Adriatic Pipeline interconnection. Nevertheless, all the interconnections with neighbouring countries are showing infrastructure limitations which do not allow Greece to have access to more gas.
- Slovenia situation is unchanged without any project improving its diversification.
- Bosnia and Herzegovina and North Macedonia situations are unchanged with 100 % risk of demand curtailment.
- Serbia mitigates risk of demand curtailment (90 % to 27 %) with new interconnections with Bulgaria and Trans Balkan Pipeline.

Figure 4.120: Maximum exposure to demand curtailment in case of SLID in Existing and Low infrastructure levels in 2030 for all scenarios.
2040
North Eastern Europe
- The situation is unchanged for Denmark and Sweden.
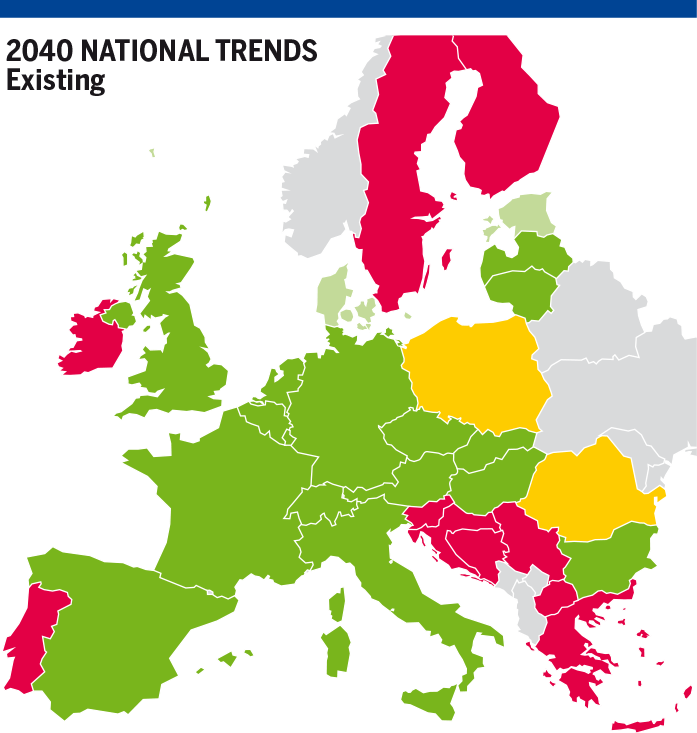
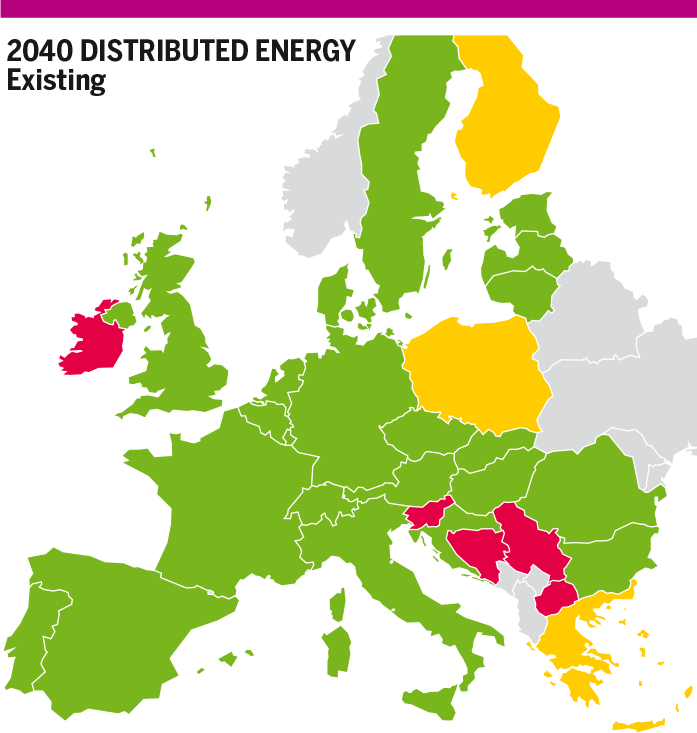
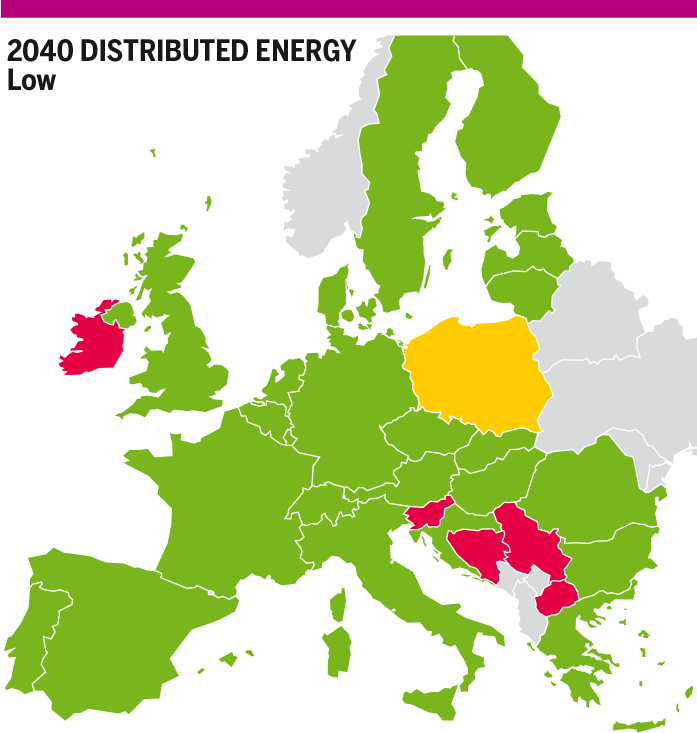
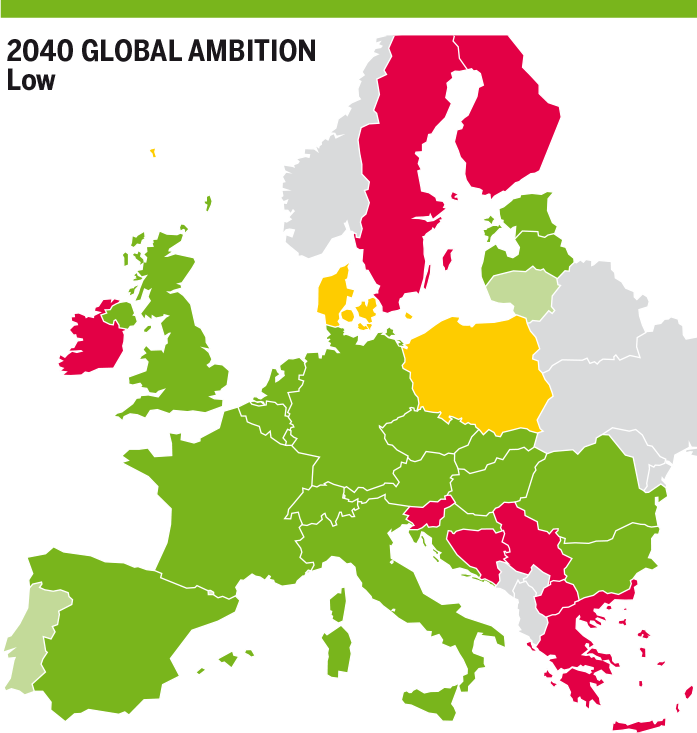
- Finland fully mitigates risk of demand curtailment in Distributed Energy scenario, thanks to Baltic Connector increase capacity. Risk of demand curtailment is mitigated in National Trend and Global Ambition scenarios due to high demand in these scenarios not compensated by the increase capacity between Estonia and Finland.
- Poland mitigates risk of demand curtailment in National Trend scenario thanks to Slovakia and Lithuania new interconnections. The situation is unchanged for the other scenarios.
- Romania mitigates risk of demand curtailment in National Trends scenario (12 %) thanks to increase storage capacity project.
- Lithuania is now exposed to demand curtailment in Global Ambition scenario (9 %) due to high demand value for this scenario and its cooperation with Poland thanks to new interconnection with Poland (GIPL).
Eastern Europe
- Greece fully mitigates risk of demand curtailment in Distributed Energy scenario thanks to indigenous production and Trans Adriatic Pipeline interconnection. Risk of demand curtailment is mitigated in National Trend and Global Ambition scenarios (16 % and 26 %). All the interconnections with neighbouring countries are showing infrastructure limitations and do not allow Greece to have access to more gas.
- Slovenia situation is unchanged without any project improving its diversification.
- Bosnia and Herzegovina and North Macedonia situations are unchanged with 100 % risk of demand curtailment.
- Serbia mitigates risk of demand curtailment (53 % to 28 %) with new interconnections with Bulgaria and Trans Balkan Pipeline.
Western Europe
- The situation is unchanged for Portugal, Ireland and Northern Ireland.

Figure 4.121: Maximum exposure to demand curtailment in case of SLID in Existing and Low infrastructure levels in 2040 for all scenarios.
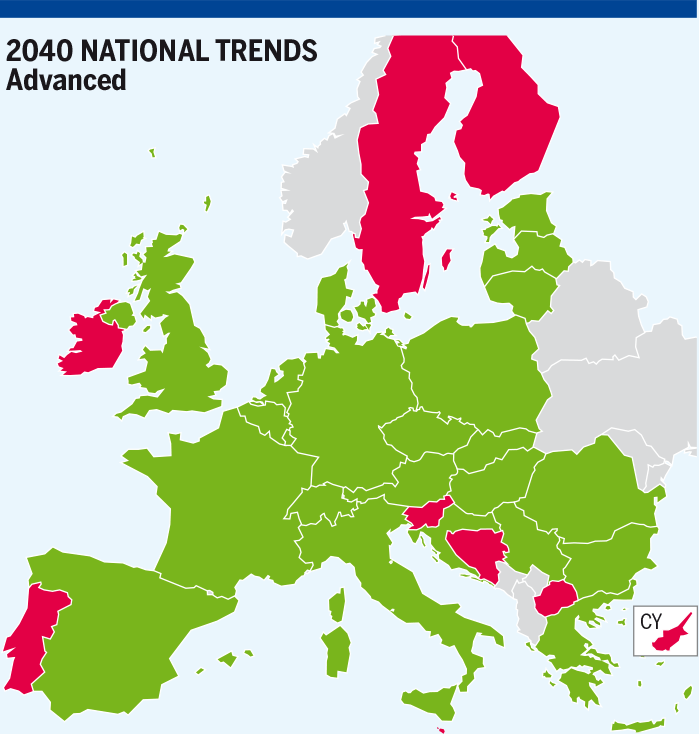
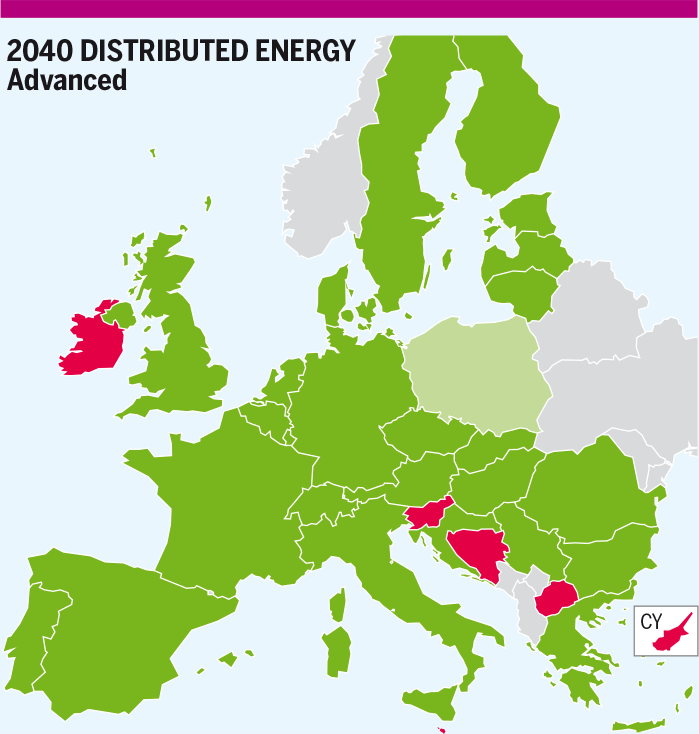
4.5.3 Advanced Infrastructure Level
The results of the indicator in Advanced infrastructure level allows to bring an instructive light on the impact of Advanced projects and the necessary infrastructure projects still needed in order to reduce or even eliminate all risks of demand curtailment under disruption of the Single Largest Infrastructure. Advanced projects further improve the resilience of the gas infrastructure and significantly mitigate the exposure of many countries to the disruption of their Single Largest Infrastructure.
2025
North Eastern Europe
- The situation is unchanged in Sweden and Finland without any project in these countries.
- Estonia is no more exposed to demand curtailment thanks to LNG terminal project. Baltic connector is showing infrastructure limitation and Estonia can’t cooperate more with Finland.
Eastern Europe
- Greece fully mitigates risk of demand curtailment thanks to projects Poseidon Pipeline.
- Serbia fully mitigates risk of demand curtailment thanks to new interconnections with Croatia and Romania.
- North Macedonia is no more exposed to demand curtailment thanks to the new interconnection with Greece.
- Slovenia, Bosnia and Herzegovina situations are unchanged.
- Malta and Cyprus are exposed to risk of demand curtailment (100 %).
Western Europe
- The situation is unchanged for Portugal and Ireland.
- Northern Ireland mitigates risk of demand curtailment (100 % to 23 %) thanks to the UGS project Islandmagee Gas Storage Facility.
2030
North Eastern Europe
- Denmark fully mitigates risk of demand curtailment due to new interconnection with Poland and increase capacity from Norway.
- Situation in Sweden and in Finland is unchanged.
- Estonia is no more exposed to demand curtailment thanks to LNG terminal project. Baltic connector is showing infrastructure limitation and Estonia can’t cooperate more with Finland.
- Poland fully mitigates risk of demand curtailment thanks to new interconnections with Denmark and increase capacity with Czech Republic, Slovakia and Ukraine.
Western Europe
- The situation is unchanged for Portugal and Ireland.
- Northern Ireland mitigates risk of demand curtailment (100 % to 20 %) thanks to the UGS project Islandmagee Gas Storage Facility.
Eastern Europe
- Greece fully mitigates risk of demand curtailment in National Trend and Distributed Energy scenarios thanks to projects South Kavala (storage) and EastMed pipeline. Risk of demand curtailment is mitigated in Global Ambition scenario (9 %) due to high demand for power generation.
- Serbia fully mitigates risk of demand curtailment thanks to new interconnections with Croatia and Romania.
- North Macedonia mitigates risk of demand curtailment (42 %) with new interconnection with Greece which is now the SLI.
- Slovenia, Bosnia and Herzegovina situations are unchanged.
- Malta and Cyprus are exposed to risk of demand curtailment (100% and 46%).

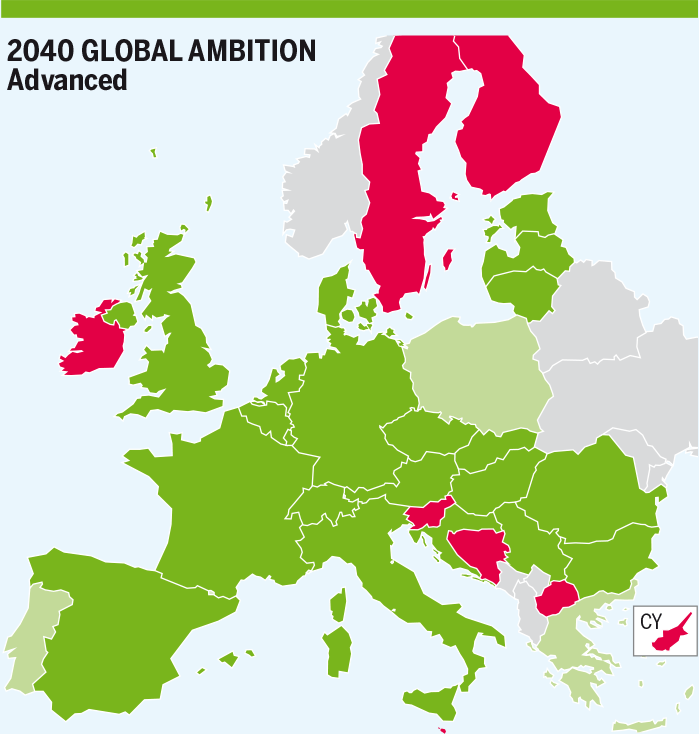
Figure 4.123: Maximum exposure to demand curtailment in case of SLID in Low and Advanced infrastructure levels in 2030 for all scenarios.
2040
North Eastern Europe
- Denmark fully mitigates risk of demand curtailment due to new interconnection with Poland and increase capacity from Norway in Global Ambition scenario.
- Situation in Sweden and in Finland is unchanged.
- Poland fully mitigates risk of demand curtailment in National Trends scenario and mitigates it in Global Ambition and Distributed Energy scenarios (4 % and 2 % respectively), thanks to new interconnections with Denmark and increase capacity with Czech Republic Slovakia and Ukraine.
- Lithuania is no more exposed to demand curtailment thanks to the interconnection projects with Poland.
- Estonia is no more exposed to demand curtailment thanks to LNG terminal project. Baltic connector is showing infrastructure limitation and Estonia can’t cooperate more with Finland.
Western Europe
- The situation is unchanged for Portugal and Ireland.
- Northern Ireland fully mitigates risk of demand curtailment in National Trends scenario and mitigates risk of demand curtailment (32 %) in Global Ambition and Distributed Energy scenarios thanks to the UGS project Islandmagee Gas Storage Facility.
Eastern Europe
- Romania fully mitigates risk of demand curtailment in National Trends scenarios thanks to new interconnections with Serbia, Eastream and increase capacity from Hungary.
- Greece fully mitigates risk of demand curtailment in National Trend thanks to projects Poseidon pipeline. Risk of demand curtailment is mitigated in Global Ambition scenario (4 %) due to high demand for power generation.
- Serbia fully mitigates risk of demand curtailment thanks to new interconnections with Croatia and Romania.
- North Macedonia mitigates risk of demand curtailment with new interconnection with Greece which is now the SLI.
- Slovenia, Bosnia and Herzegovina situations are unchanged.
- Malta and Cyprus are exposed to risk of demand curtailment (100% and 47%).

Figure 4.124: Maximum exposure to demand curtailment in case of SLID in Low and Advanced infrastructure levels in 2040 for all scenarios.
4.5.4 PCI Infrastructure Level
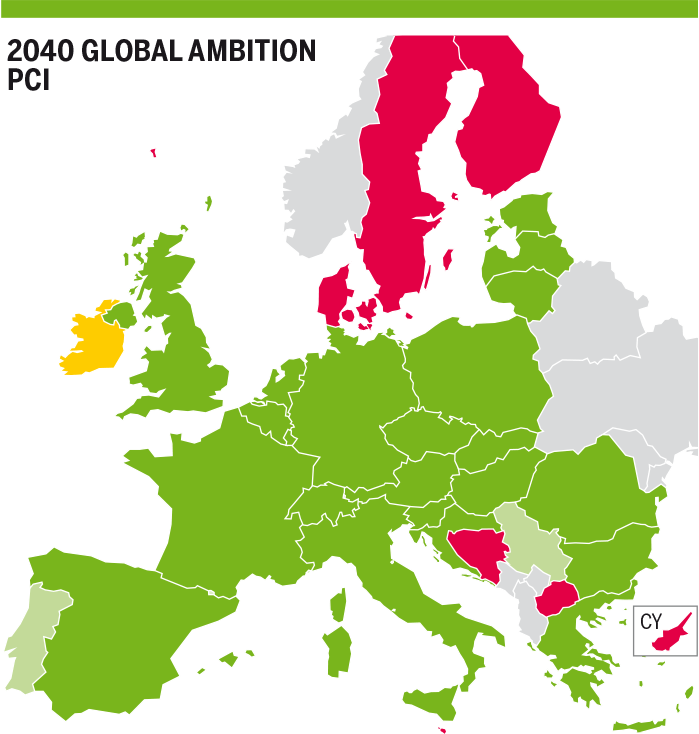
The results of the indicator in PCI infrastructure level allows to bring an instructive light on the impact of PCI projects and the necessary infrastructure projects still needed in order to reduce or even eliminate all risks of demand curtailment under disruption of the Single Largest Infrastructure. PCI projects, like Advanced projects, improve the resilience of the gas infrastructure and significantly mitigate the exposure of many countries to the disruption of their Single Largest Infrastructure. However, the situation is different from country to country.
2025
North Eastern Europe
- The situation is unchanged for Sweden, Finland and Estonia.
Eastern Europe
- Greece fully mitigates risk of demand curtailment thanks to new connection with Cyprus and increase capacity with Compressor Station Kipi project which mitigates bottleneck in Greece.
- Slovenia mitigates risk of demand curtailment (4 %) thanks to new interconnection with Hungary increase capacity with Croatia. Croatia is now exposed to demand curtailment (3 %) due to cooperation Slovenia.
Western Europe
- The situation is unchanged for Portugal and in Northern Ireland.
- Ireland mitigates risk of demand curtailment (57 %) thanks to terminal project (Shannon).
2030
North Eastern Europe
- Denmark mitigates risk of demand curtailment in Distributed Energy and Global Ambition (10 % and 13 % respectively) thanks to the new interconnection with Poland and increase capacity from Norway. Sweden is still exposed to risk of demand curtailment in Global Ambition scenario due to infrastructure limitation with Denmark.
- In case of Swedish SLID, Sweden situation is unchanged.
- Situation in Finland and in Estonia are unchanged.
- Poland fully mitigates risk of demand curtailment thanks to LNG terminal increase capacity and new interconnections with Denmark.
Western Europe
- Ireland mitigates risk of demand curtailment (from 85 % to 7 % in National Trends scenario and from 90 % to 20 % in Global Ambition and Distributed Energy scenarios) thanks to increase capacity from terminal (Shannon).
- The situation is unchanged for Portugal and in Northern Ireland.
Eastern Europe
- Greece fully mitigates risk of demand curtailment thanks to new connection with Cyprus (EastMed) and increase capacity with Compressor Station Kipi project which mitigates bottleneck.
- Serbia mitigates risk of demand curtailment (2 %) thanks to new interconnection with Bulgaria in all scenarios.
- Slovenia fully mitigates risk of demand curtailment thanks to increase capacity with Hungary and increase interconnection with Croatia.
- North Macedonia and Bosnia and Herzegovina situations are unchanged.
- Malta and Cyprus are exposed to risk of demand curtailment (100% and 46%).

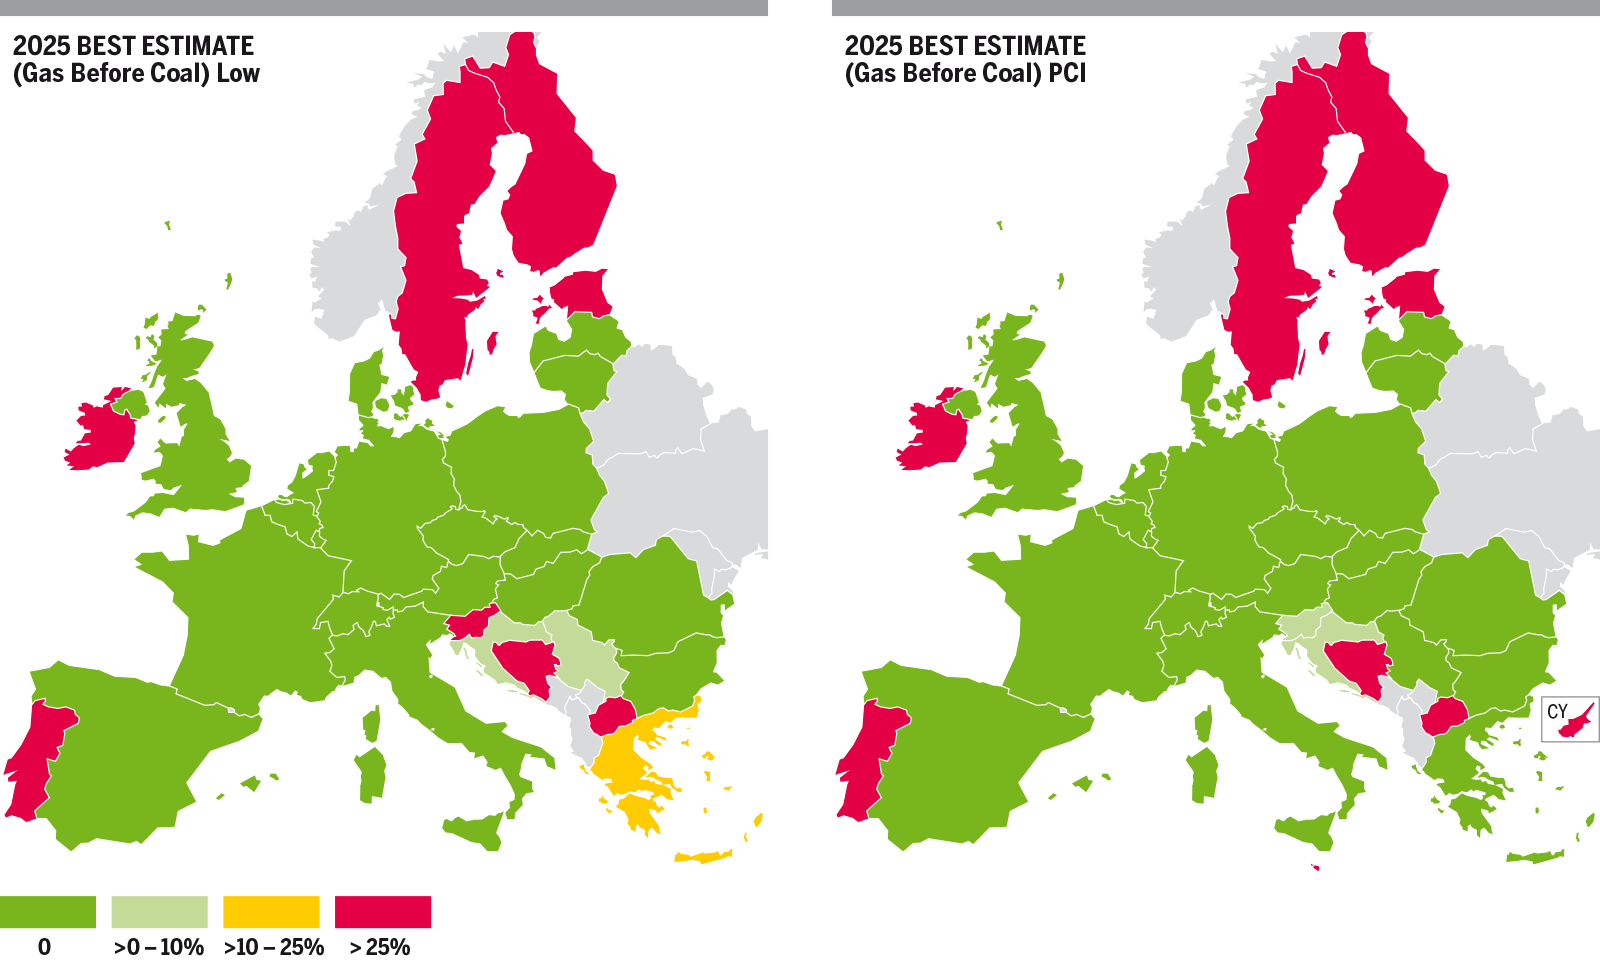
Figure 4.126: Maximum exposure to demand curtailment in case of SLID in Low and PCI infrastructure levels in 2030 for all scenarios.
2040
North Eastern Europe
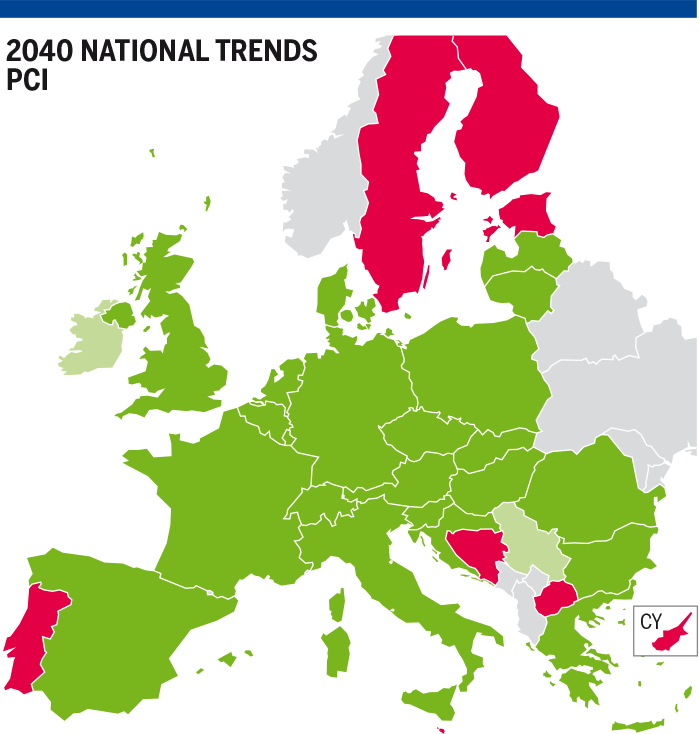
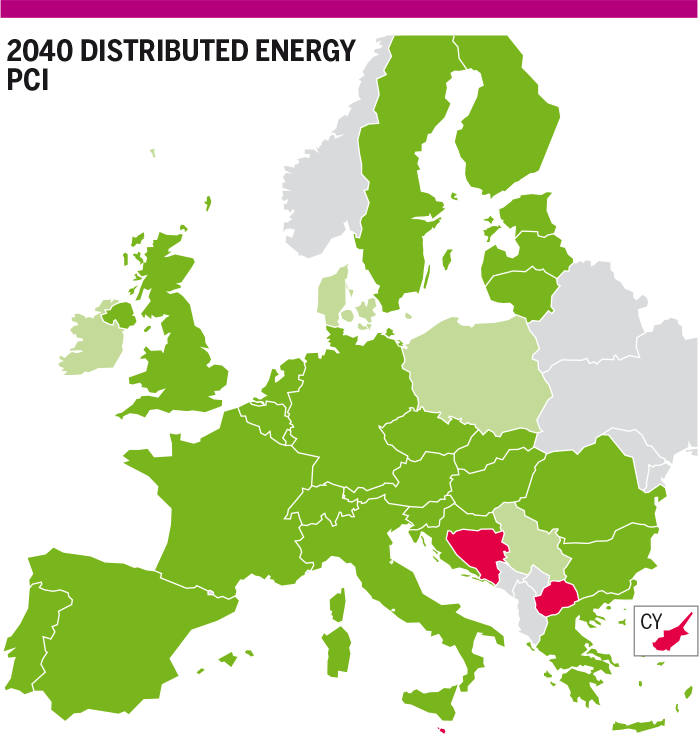
- Denmark fully mitigates risk of demand curtailment in National Trends scenario and mitigates it in Global Ambition scenario. In Distributed Energy scenario, Denmark is now exposed to a slight demand curtailment due to the cooperation with Poland, thanks to the new interconnection with Poland and increase capacity from Norway. The impact is fully mitigated in Sweden in Distributed Energy scenario and mitigated in Global Ambition scenario.
- In Global Ambition and Distributed Energy scenarios, Poland mitigates risk of demand curtailment (12 % and 7 % respectively) and fully mitigates it in National Trends scenario. Poland improved its situation thanks to LNG terminal increase capacity and new interconnections with Denmark.
- The situation is unchanged in Sweden, in Finland and in Estonia.
Western Europe
- Ireland mitigates risk of demand curtailment thanks to increase capacity from terminal (Shannon) in National Trends scenario from 80 % to 3 %, in Distributed Energy scenario from 70 % to 2 % and in Global Ambition scenario from 86 % to 19 %.
- The situation is unchanged in Portugal and Northern Ireland.
Eastern Europe
- Romania fully mitigates risk of demand curtailment in National Trends scenario thanks to new interconnections with Serbia, Eastream and increase capacity from Hungary.
- Greece fully mitigates risk of demand curtailment thanks to new interconnection with Cyprus (EastMed) and increase capacity with Compressor Station Kipi project which mitigates bottleneck.
- Serbia mitigates risk of demand curtailment (3 %) thanks to new interconnection with Bulgaria in all scenarios.
- Slovenia fully mitigates risk of demand curtailment thanks to increase capacity with Hungary and increase interconnection with Croatia.
- North Macedonia and Bosnia and Herzegovina situations are unchanged.
- Malta and Cyprus are exposed to risk of demand curtailment (100 % and 47 %).

Figure 4.127: Maximum exposure to demand curtailment in case of SLID in Low and PCI infrastructure levels in 2040 for all scenarios.


