This section investigates how Marginal Prices of European countries are sensitive to contrasted supply price configurations and their ability to converge. Data presented on maps are focused on Gas Before Coal and National Trends scenario line.
The Reference price per scenario and time horizon have been built using a methodology described in annex D for the different supply sources using price information from IEA World Energy Outlook 2019 and is detailed in the TYNDP Scenario report.
Infrastructure tariffs used for this TYNDP reflects the 2019 tariffs for Transmission and tariffs used for LNG and Storage are described in the annex D.
It is not expected that the reference supply prices, or arbitrary price differentials selected will materialise in the future, nor that the prices determined in the EU’s internal hubs by modelling will fully reflect internal demand and supply drivers. As the market context is continuously evolving it is hard to provide an up-to-date representation. However, the Marginal Price Indicator delivers results and insights based on the assumed gas prices by showing how market forces could interact and evolve.
Interpretation of marginal prices
A difference in marginal price between two connected countries can be the result of a transmission tariff, an infrastructure limitation or both.
As reference marginal prices are different for every year, every scenario and every infrastructure level of the assessment, comparisons between countries and supply configurations are valuable only when comparing within the same year and same scenario.
For the purpose of maximising and minimising supply flows from individual sources in order to assess extreme transportation potentials of the grid a standardised approach has been defined. For the minimisation and maximisation of supplies the price curves of these supplies are set higher or lower by an arbitrary spread of 5 €/MWh making this supply more or less preferred to meet the demand. The import price of the other sources is not changed.
The following supply configurations were analysed:
- Russian gas supply maximised (low Russian price)
- Russian gas supply minimised (high Russian price)
- LNG supply maximised (low LNG price)
- LNG supply minimised (high LNG price)
- South gas supply gas maximised (low Caspian, Libyan, Algeria prices)
- South gas supply gas minimised (low Caspian, Libyan, Algerian prices)
In the presented further maps, the reference price is used to compare the marginal prices. It is the same average price used in the Reference Supply Configuration case for the same scenario and the same years in each infrastructure level. It is the demand weighted average taking into consideration all investigated countries. As the main goal is to measure convergence across the Europe, this way of setting the reference price does not allow directly compare numerical results between two different infrastructure level, but it is more focused to observe how specific infrastructure level and scenario assumptions are affecting range of Marginal Prices and its evolution with specific supply configurations.
Simulation of maximum usage of one gas source by setting its price lower than others is affecting the result by lowering Marginal Price value. And in the same way it is elevating the results of Marginal Price when there is a need to investigate high price of gas from specific source. This is not the way to investigate convergence. To properly investigate results, it is important to compare how results of the Marginal Prices are converging (approaching the same value). The numerical result value of Marginal Price is not that important as similar reaction to signal from the market. Bottleneck or no connection between countries will limit possibility of convergence and it will be visible in Reference supply price configuration case or any other supply price configuration. In the same way prices in countries are not converging when price in one country is much higher or much lower than Reference Marginal Price calculated for each scenario, year and infrastructure level.
5.5.1 Existing Infrastructure Level
In Existing infrastructure level, results of the indicator are not influenced by any project layer, it means that in all years and scenarios infrastructure remain the same as at the end of 2019 year. Marginal Price results in different countries (and in the same time on the Reference Marginal Price for specific year and scenario) are consequence of assumptions regarding the demand, national production, transmission tariffs and existing capacities between different countries. This way of calculation of the Marginal Price is used for Reference supply price configuration. For further investigation of the convergence between European countries, calculations were repeated with application of supply configurations explained at the beginning of the chapter.
Reference Supply Configuration
Reference supply price configuration in Existing infrastructure level shows that gas prices generally converge in Europe and mainly reflect the cross-border transmission tariffs. However, gas prices in Central and South of the Europe together with Baltic states are not fully aligned with Western Europe due to infrastructure limitations and could not further converge. Convergence means that prices react in similar way to gas price signals. This situation is affected by lack of the infrastructure, bottlenecks and high tariffs in the context of input data such as demand, gas production, and tariffs. Together with the years and scenarios there is change in convergence observed, which is caused only by input data. Central-Eastern Europe (specifically Poland), Southern Europe and Baltic states have limited possibility to satisfy demand using gas on the same price level as Western Europe.
Situation in Poland is related to increase in demand because of the coal to gas switch projects. Denmark and Sweden in 2025 Gas Before Coal and 2030 National Trends are not converging with rest of the Europe as well, having relatively high national production compared to demand and in the same time having limited possibility share this gas with rest of the Europe.
Maps show a relation between the Reference Marginal Price calculated for each infrastructure level and Marginal price of specific country. When the Marginal Price is lower than the Reference Marginal Price, countries are coloured in one of the green shades (according to range of the difference). When difference is close to zero the colour of country is yellow, and if value is close to one or higher it is covered with orange-red colour (according to range of the difference). See Figure 5.79.
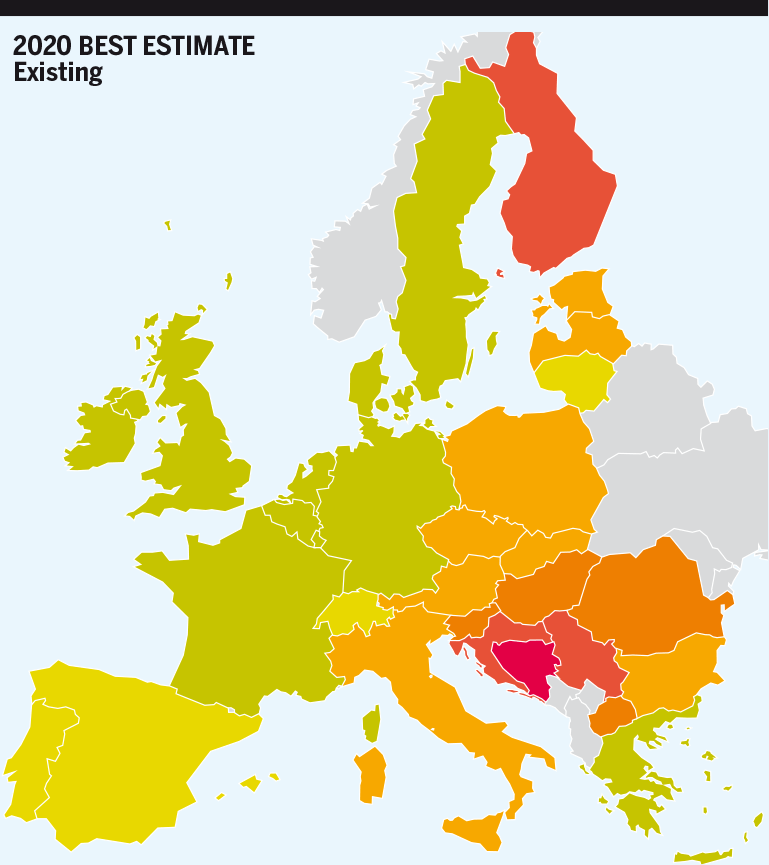
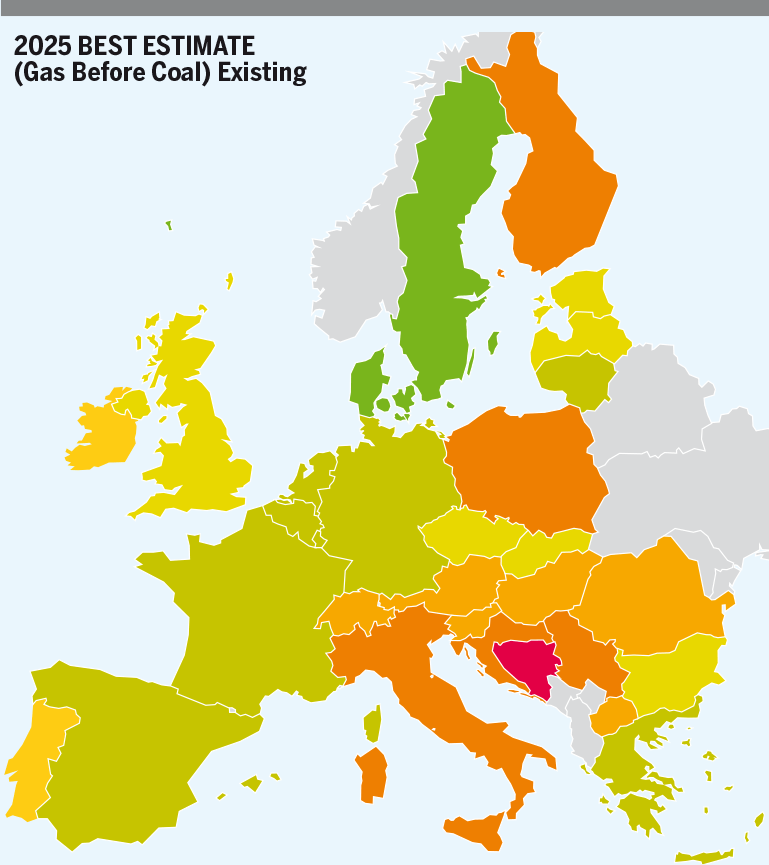
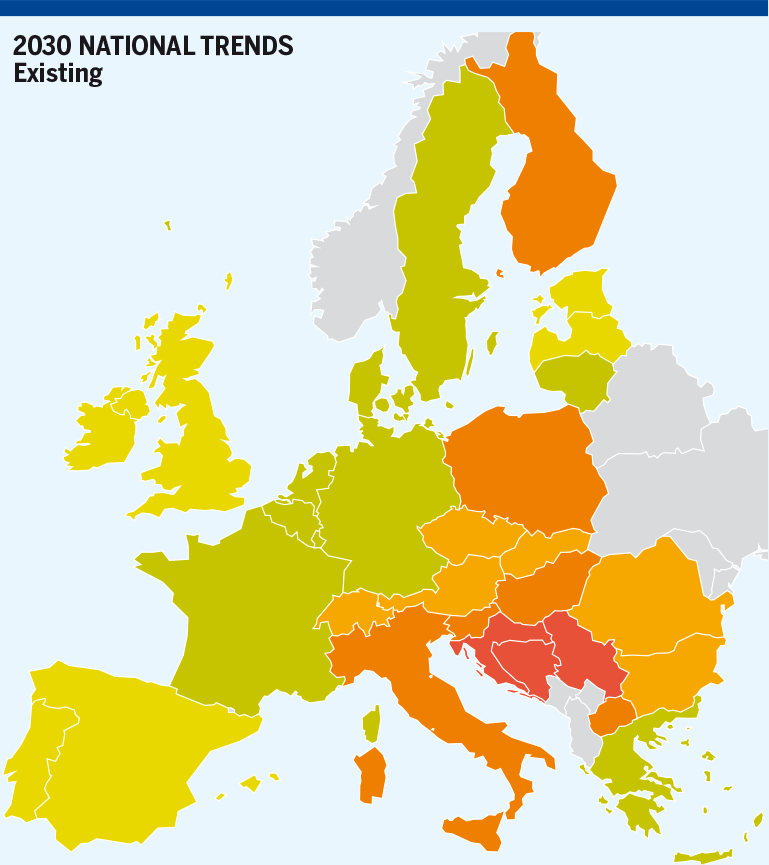
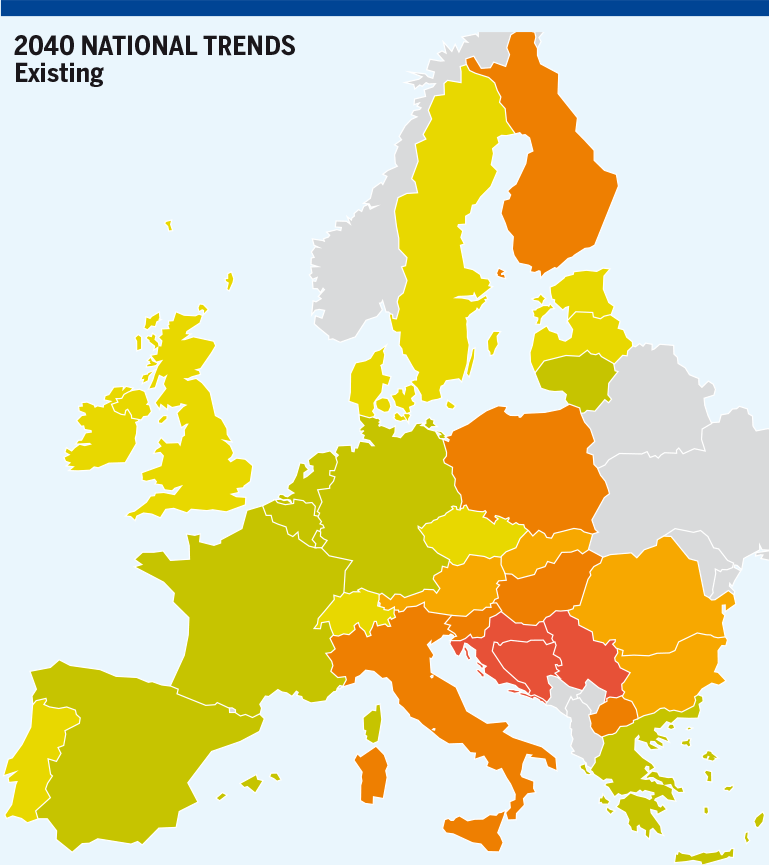
Figure 5.79: MP delta (EUR/MWh) – Existing infrastructure level, Reference supply price configuration
LNG Max
Central-Eastern and South Europe together with Baltic states are not converging with Western Europe.
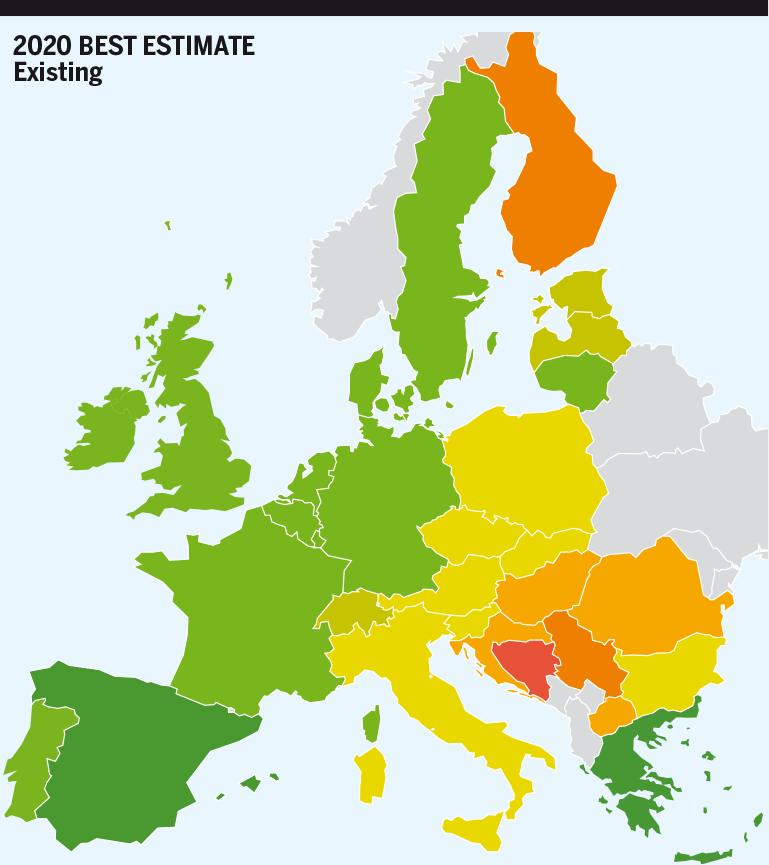
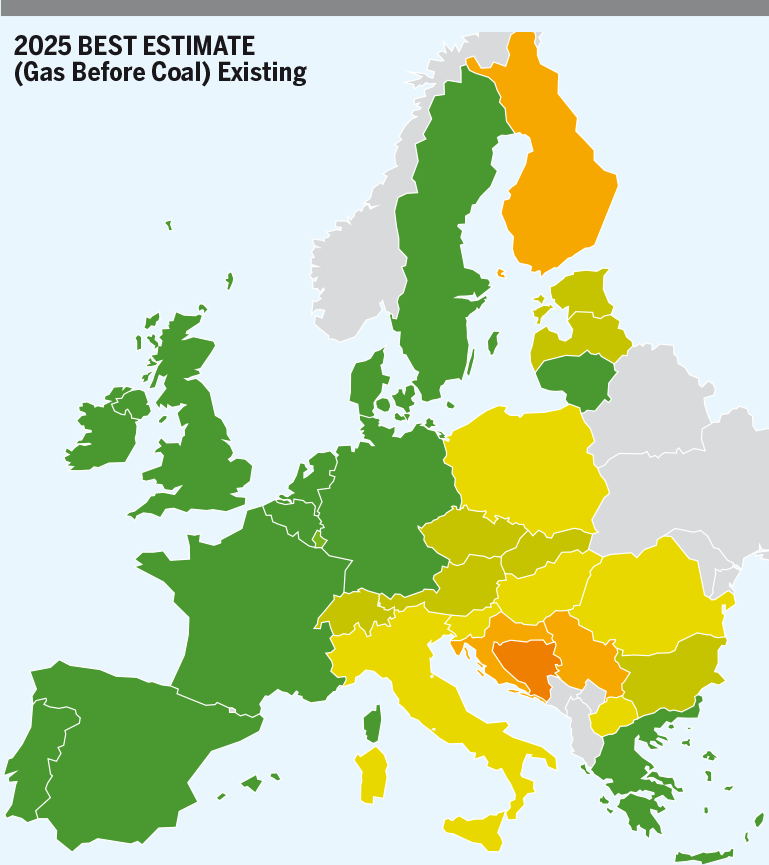
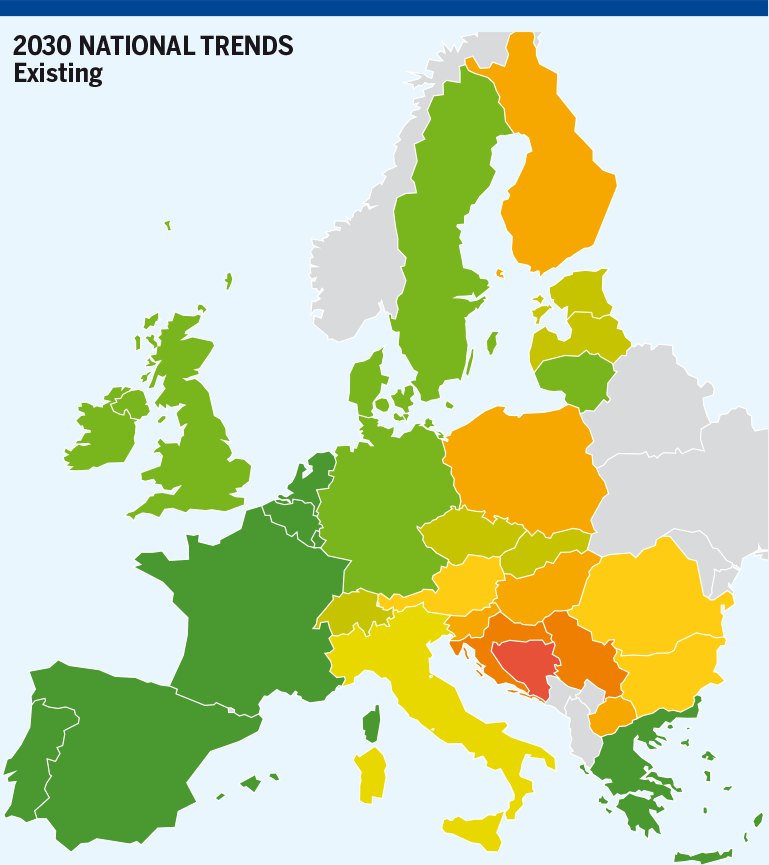
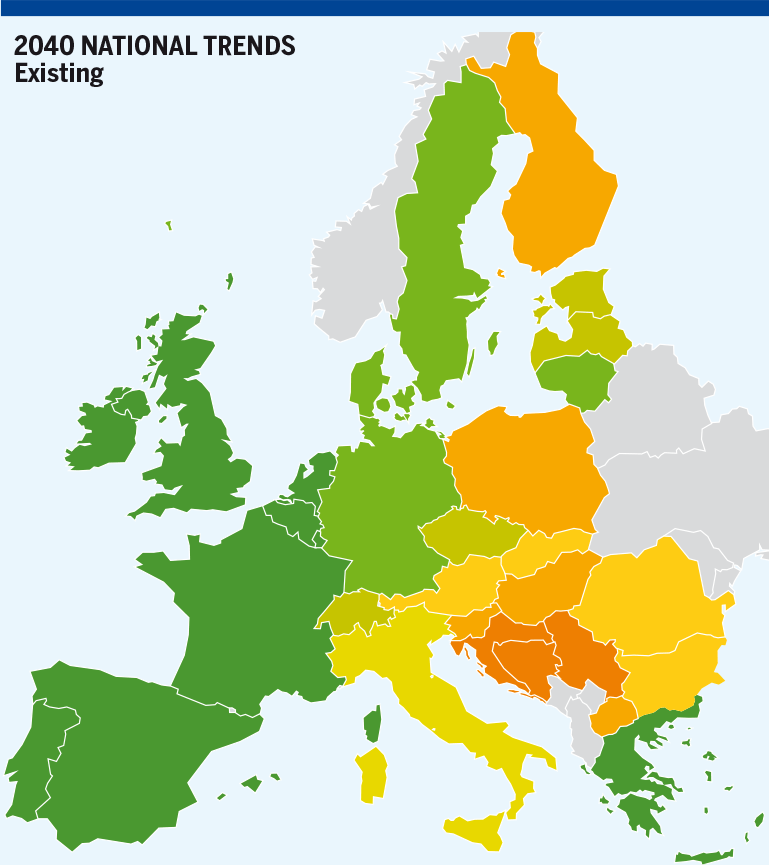
Figure 5.80: MP delta (EUR/MWh) – Existing infrastructure level, LNG Max supply configuration
LNG Min
Central-Eastern and South Europe together with Baltic states are not converging with Western Europe. In Gas Before Coal 2025 trend is the same but delta between Reference Marginal Price and Marginal Price in South and Eastern Countries is going above 4 EUR/MWh.
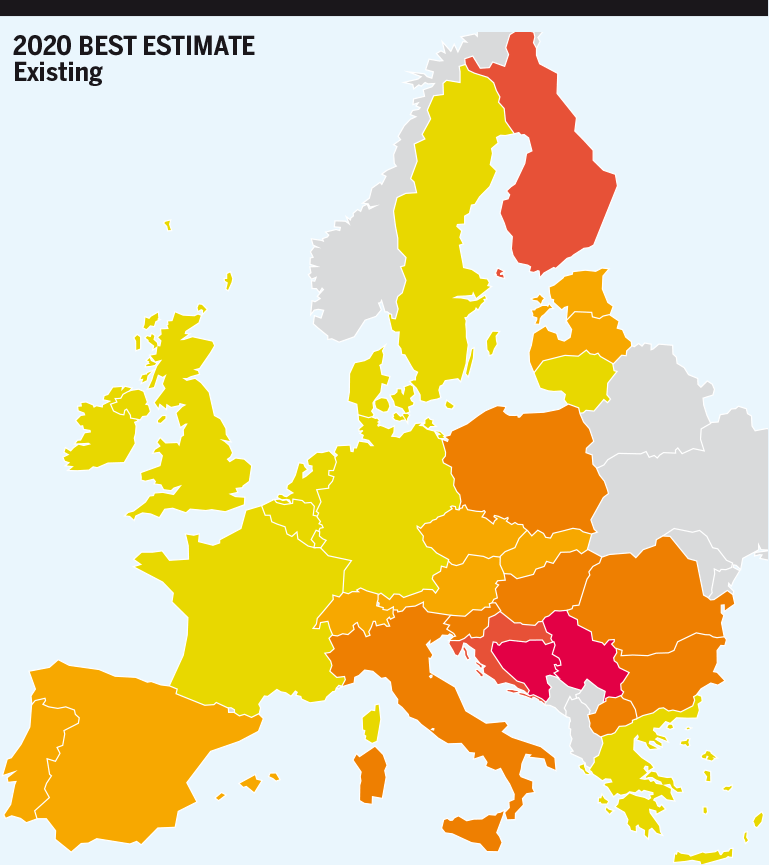
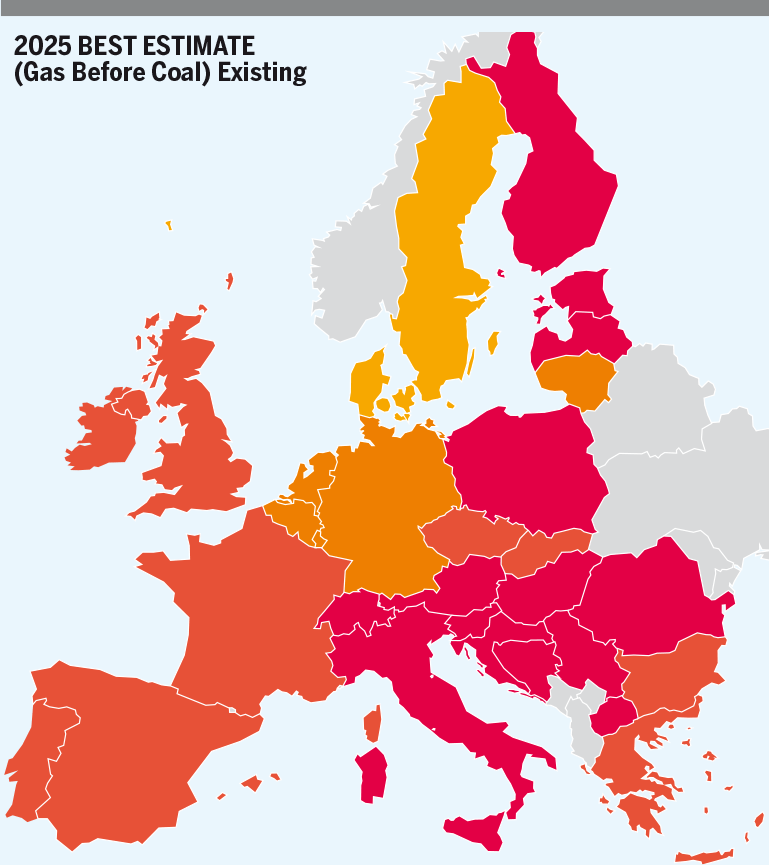
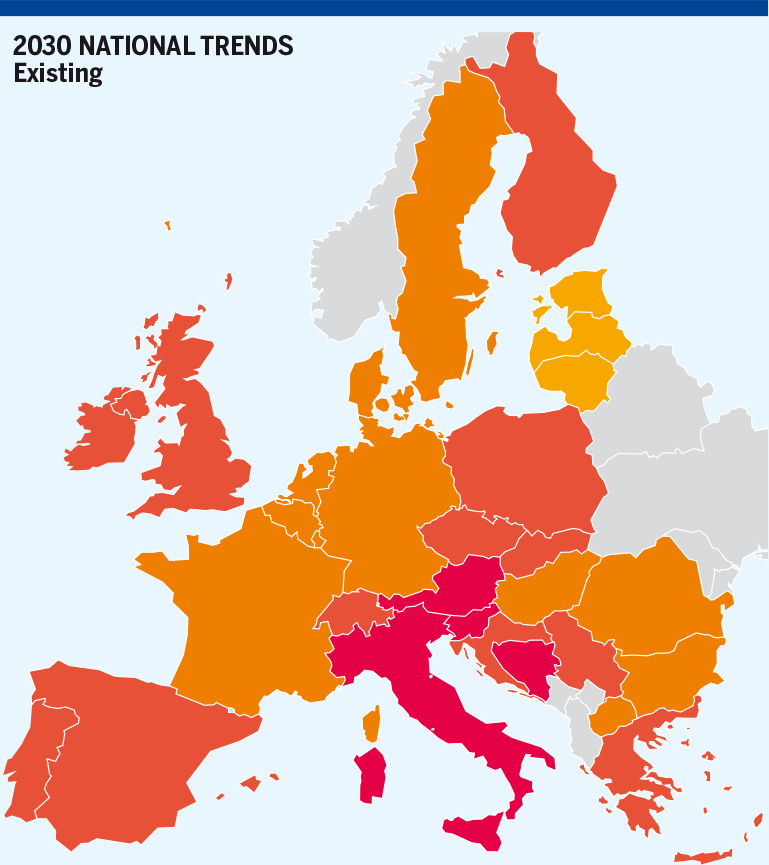
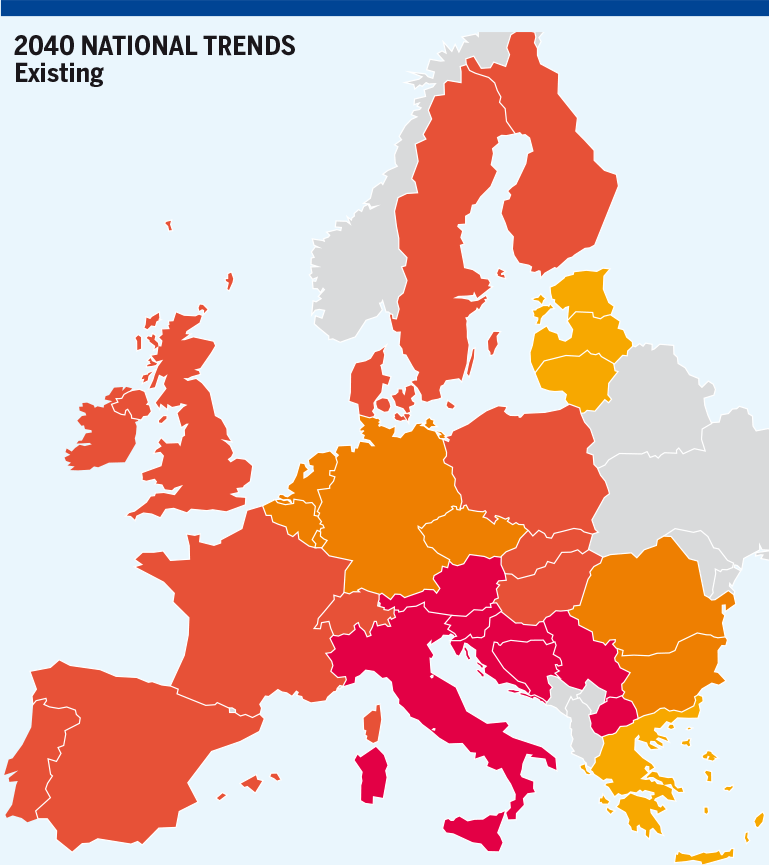
Figure 5.81: MP delta (EUR/MWh) – Existing infrastructure level, LNG Min supply configuration
RU Max
In countries with relatively high demand comparing to limited cross-border capacities and national production, possibility to observe price convergence is limited. In 2025 Gas Before Coal in Poland, Italy, Bosnia and Herzegovina, Finland, Croatia and Serbia, Marginal Price is not converging like in the rest of Europe. In National Trends 2030 and 2040 Italy, its northern and eastern neighbours are not converging with the rest of the Europe on the same level which indicates infrastructure limitations and higher cost of gas transportation.
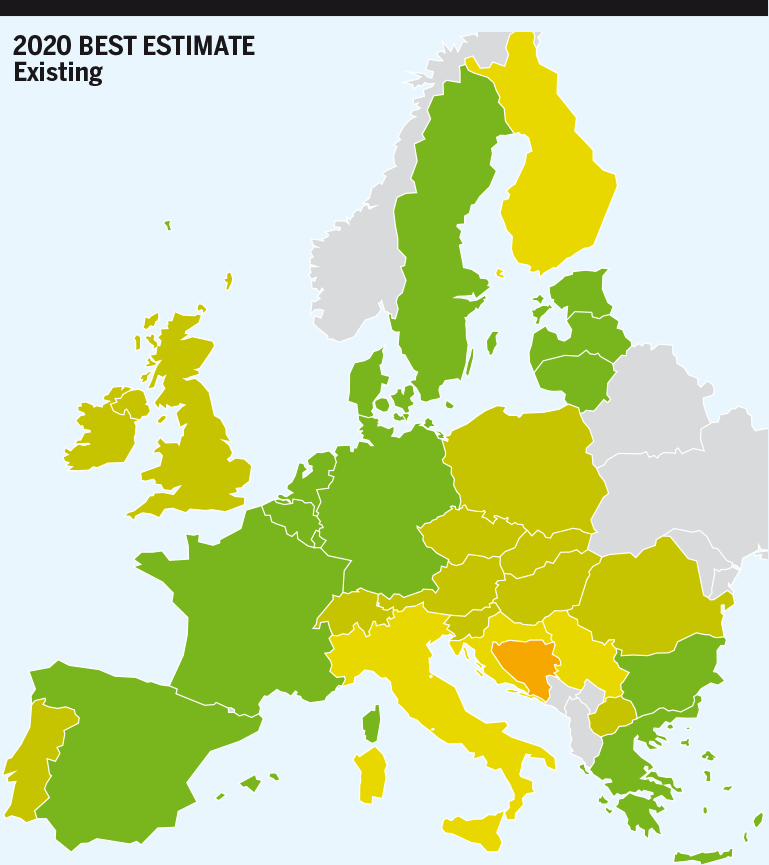
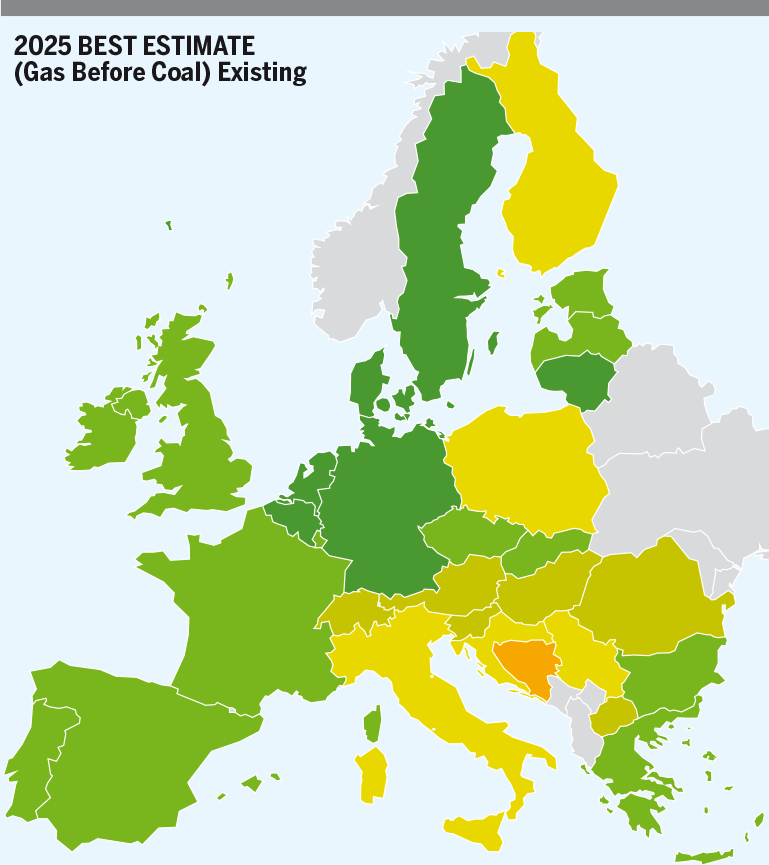
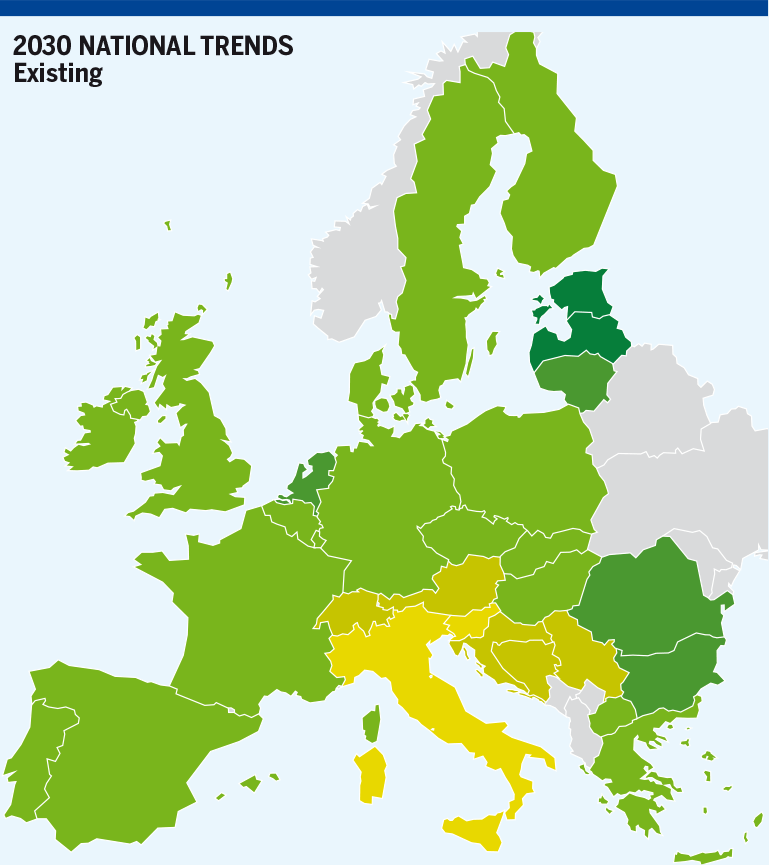
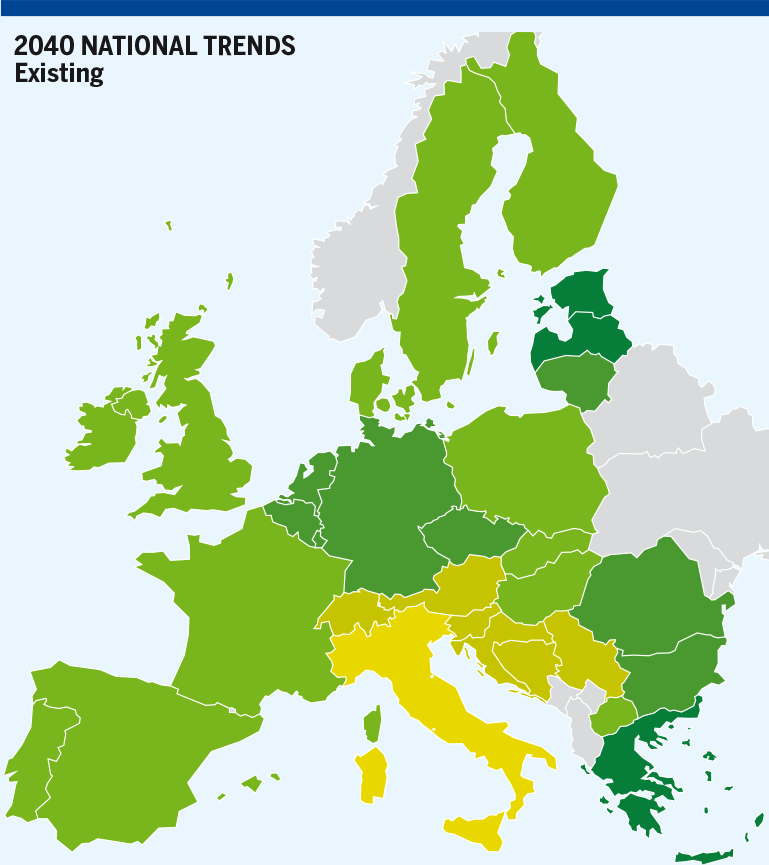
Figure 5.82: MP delta (EUR/MWh) – Existing infrastructure level, RU Max supply configuration
RU Min
Central-Eastern and South Europe together with Baltic states are not converging with Western Europe.
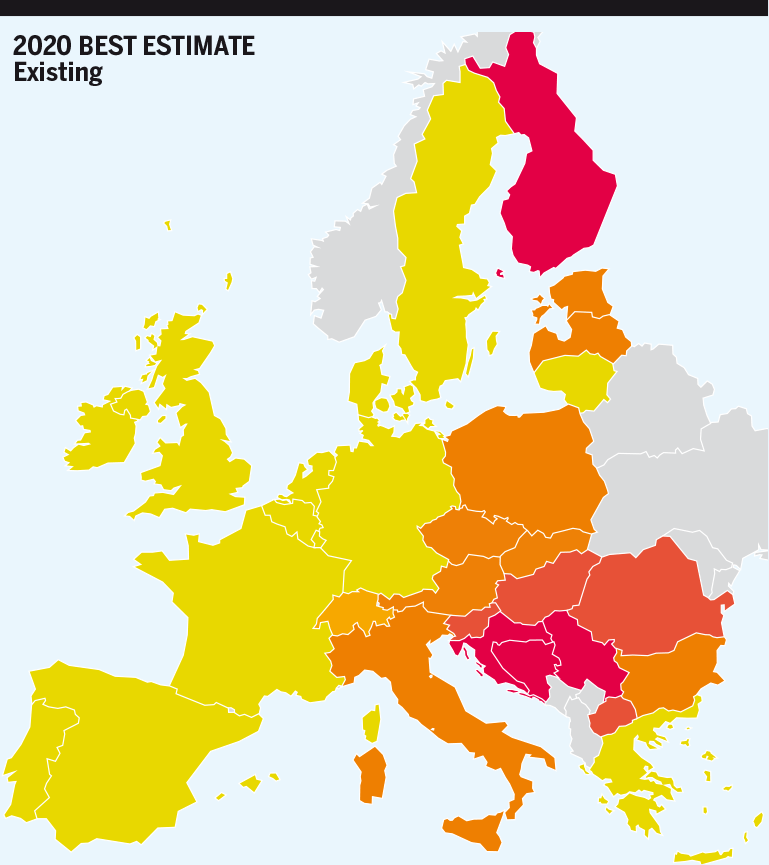
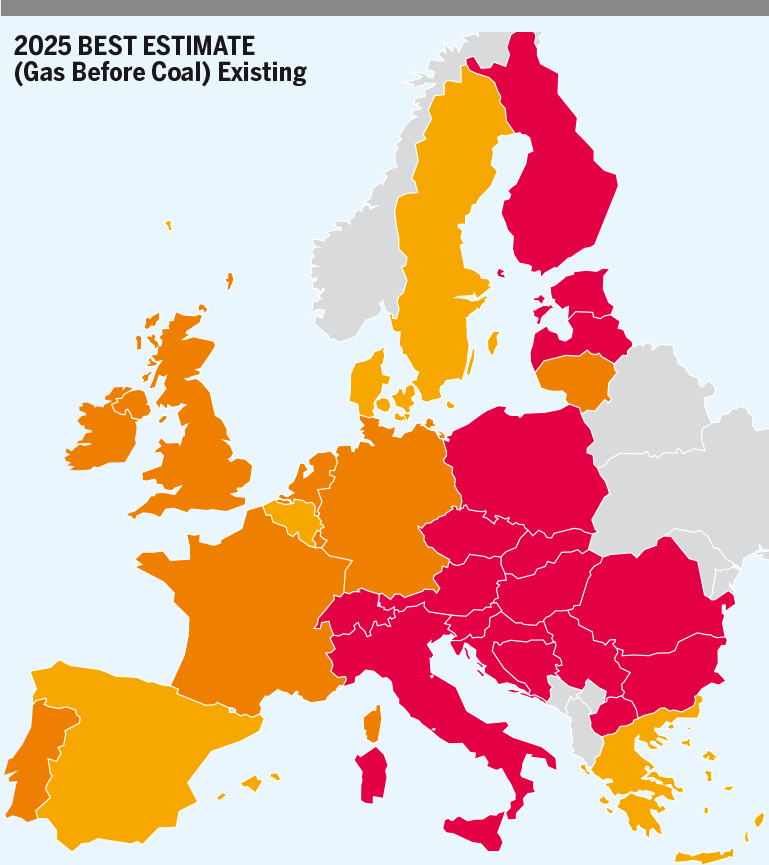
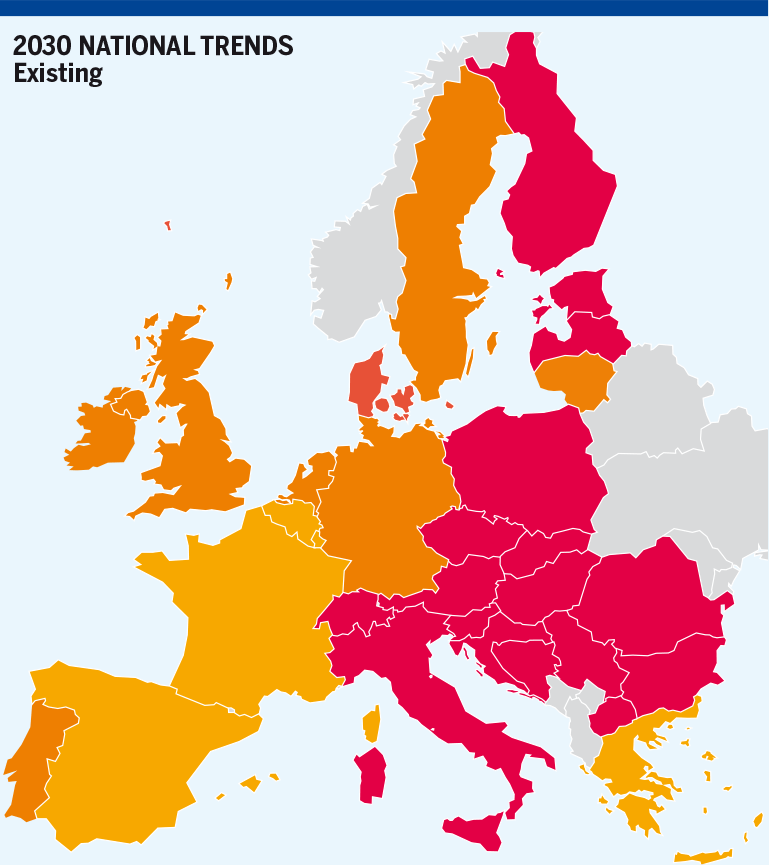
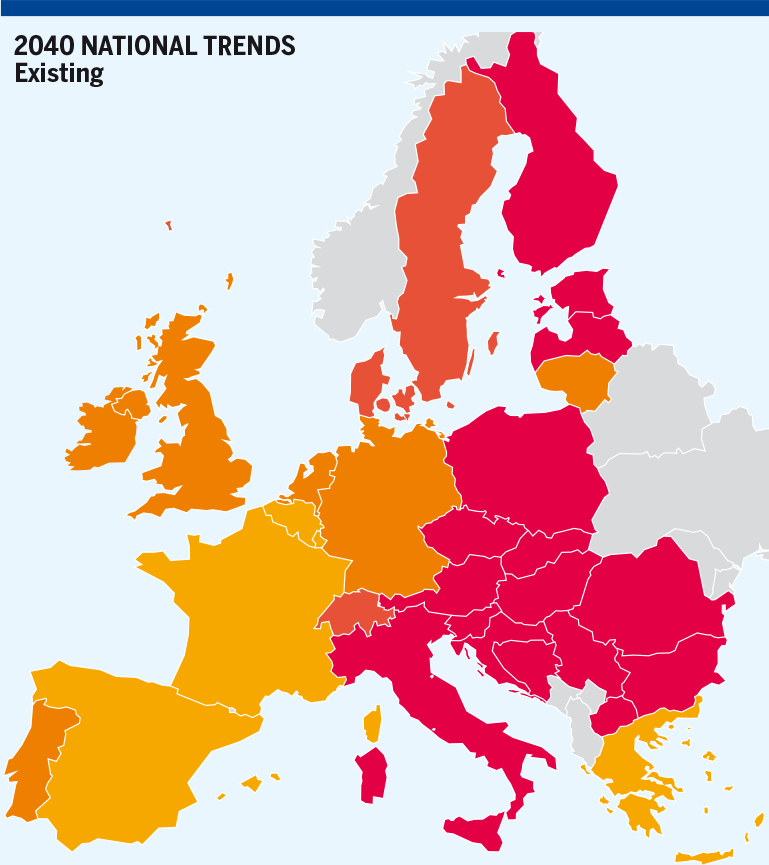
Figure 5.83: MP delta (EUR/MWh) – Existing infrastructure level, RU Min supply configuration
South Max
Central-Eastern and South Europe together with Baltic states are not converging with Western Europe. No significant differences were observed in comparison to Reference case.
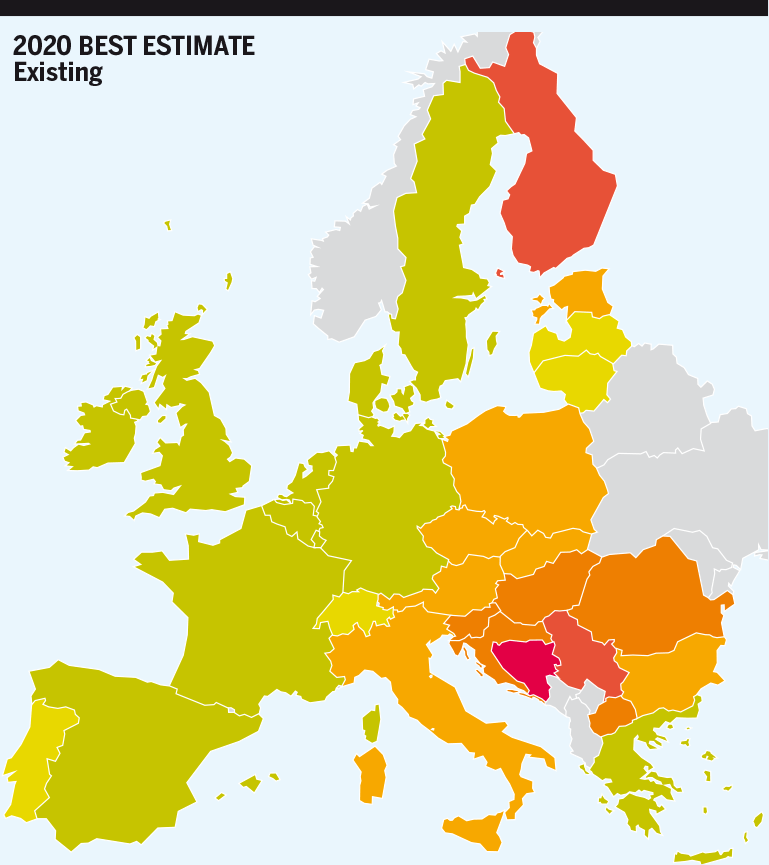
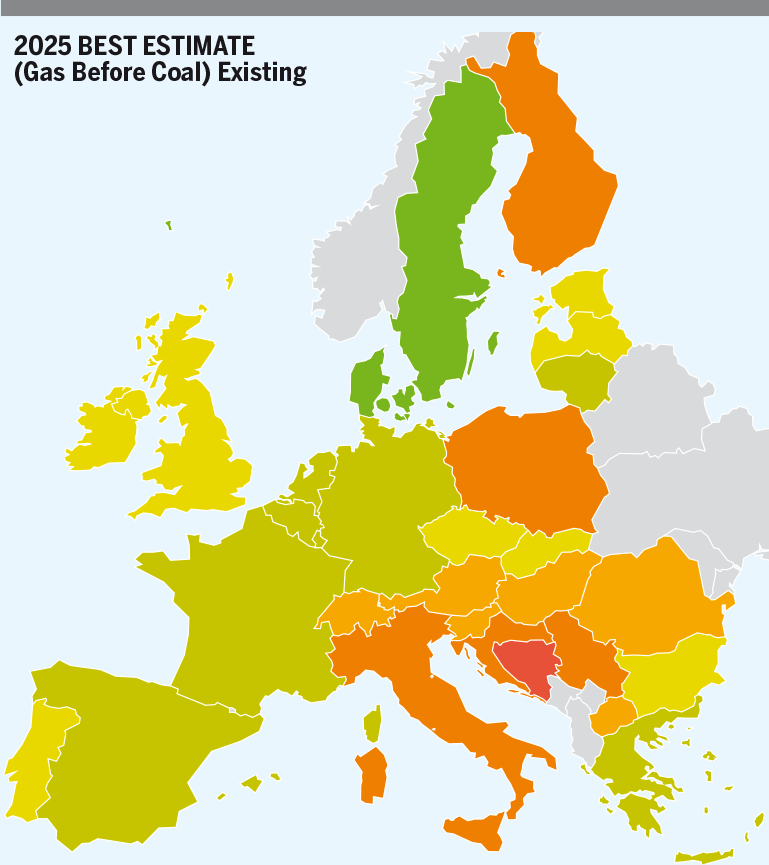


Figure 5.84: MP delta (EUR/MWh) – Existing infrastructure level, South Max supply configuration
South Min
Central-Eastern and South Europe together with Baltic states are not converging with Western Europe slightly affected by this supply situation.
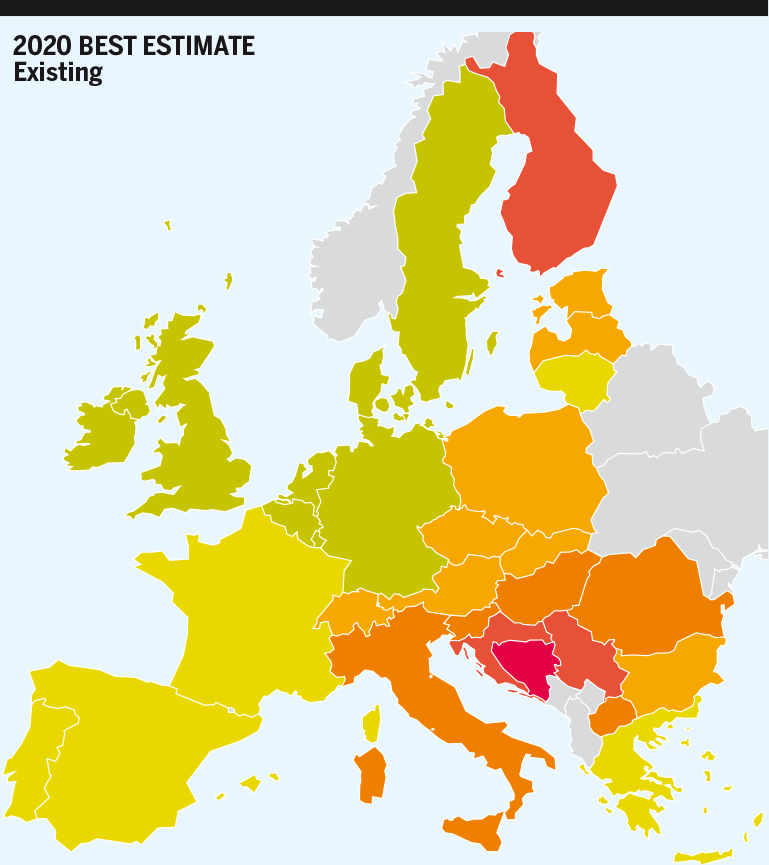
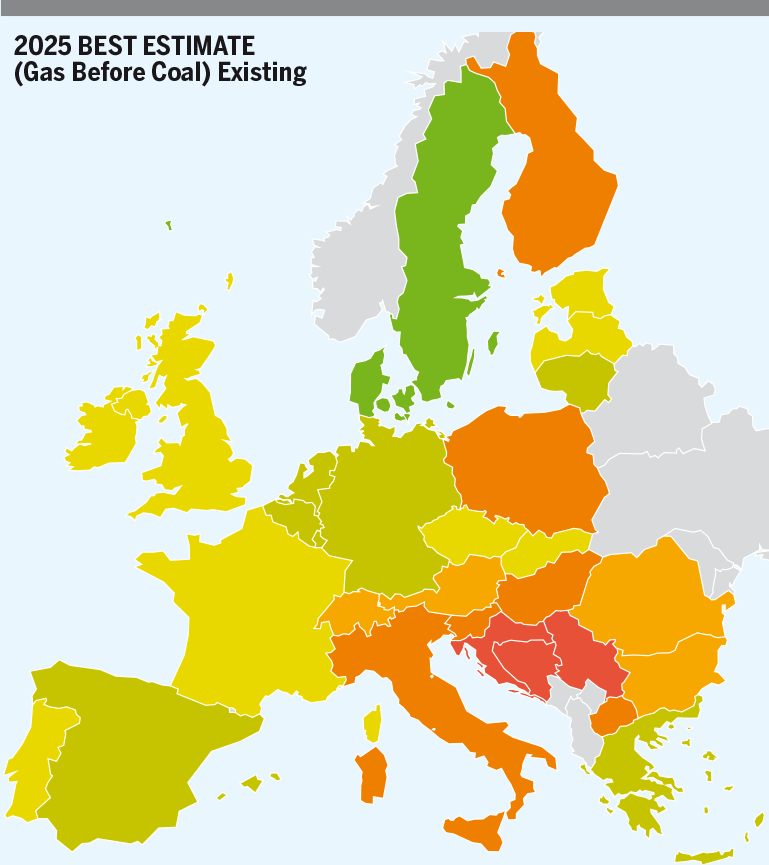
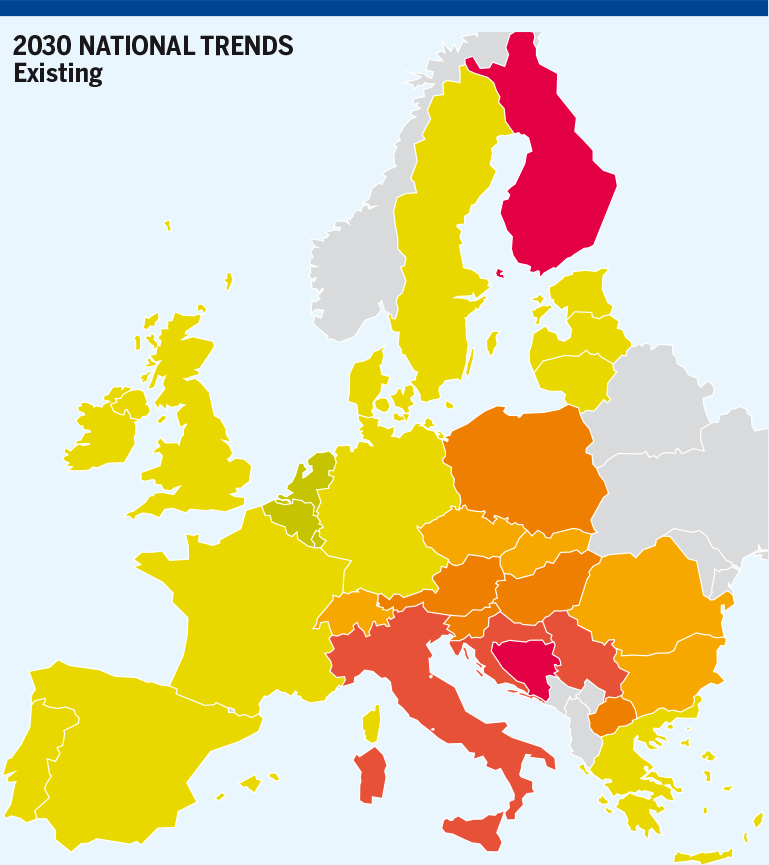
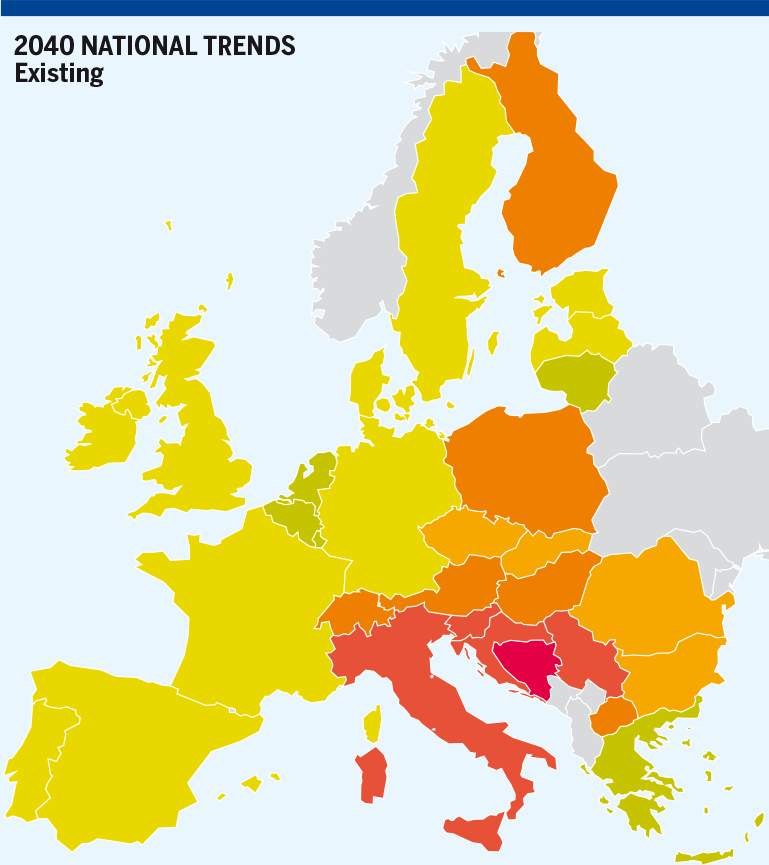
Figure 5.85: MP delta (EUR/MWh) – Existing infrastructure level, South Min supply configuration
Conclusion
2020
East West
The existing gas infrastructure can ensure an efficient price convergence in case of competitive Eastern supply: in case of cheap Russian supply or expensive LNG supply, most European countries can benefit from a cheaper Eastern supply.
West East
Thanks to its access to LNG, the western part of the EU can generally benefit from a competitive LNG supply (see LNG max configuration). In the same time cost of gas transportation of the LNG from Western Europe and infrastructure limitations between Germany and Poland, between Germany and Austria, between Austria and Hungary and Slovakia, prevent Eastern Europe from being protected from the impact of an expensive Eastern supply or from benefiting from a competitive LNG supply.
North Eastern Europe
LNG regasification capacities can help Poland and the Baltic states to benefit from a competitive LNG supply or prevent them from being too much exposed to an expensive Eastern supply. However, because of limited Indigenous production or limited access to alternative supply, those capacities are not enough for the cheapest supply in the region.
South-Eastern Europe
Greece is generally prevented from the impact of an expensive Eastern supply and can benefit from a competitive LNG price. However, infrastructure limitations between Greece and Bulgaria prevent those benefits to be shared further North.
2025
The gas demand generally remains comparable to 2020, however, the indigenous gas production declines driven by the significant decline of the conventional natural gas production from 2,750 GWh/d to 2,000 GWh/d. The recent and limited development of renewable and decarbonised gases can hardly compensate (+ 120 GWh/d between 2020 and 2025).
East West
As in 2020, the existing gas infrastructure can ensure an efficient price convergence in case of competitive Eastern supply: in case of cheap Russian supply or expensive LNG supply, most European countries can benefit from a cheaper Eastern supply.
West East
The situation remains like in 2020.
North and South Eastern Europe
The situation remains like in 2020.
National Trends
2030 – 2040
With the further decline of the indigenous natural gas production in Europe, and the limited uptake of renewable gases, the same infrastructure limitation remains and the convergence of marginal prices in case of West -> East gas flows further deteriorates.
COP 21 scenarios
Distributed Energy
2030
The significant development of renewable gases production capacities allows the EU to reach similar levels of indigenous production to 2020, renewables fully compensating for the decline of Natural Gas production. Therefore, the situation remains stable over time and Marginal Price convergence is very similar to 2025. With some limitations West -> East.
2040
In 2040, the development of renewables gases reaches significant volumes (3,800 GWh/d), more than compensating for the sharp decline of the natural gas production. Furthermore, the development of electrification and energy efficiency reduces the overall gas demand bringing more flexibility into the gas system.
East West
Marginal Prices further converge and most of the differences observed between countries reflect the transmission tariffs.
West East
The same infrastructure limitations remain between Western and Central-Eastern Europe.
North-Eastern EuropeThe development of renewable gases allows the Baltic states and Finland to have their Marginal Prices independent from Russia.
Despite the significant increase of the national production, including renewable gases; the assessment shows a significant difference between the Marginal Price in Poland and its neighbouring countries. Infrastructure shows some limitations between Poland and its neighbouring countries not accommodating with the significant increase of the Polish demand, due to the transition away from coal in power and heating, industrial and tertiary sectors.
South-Eastern Europe
The same infrastructure limitations between Greece and Bulgaria are observed.
Global Ambition
2030
The development of renewable gases production compensates for the decline of the conventional Natural Gas production and the overall European Indigenous production remains almost stable between 2025 and 2030. The overall gas demand remains stable as the demand decreases in power and tertiary sector, but at the same time, the more centralised and global development of renewable and decarbonised gases enhance the displacement of carbon intensive fuels by gas, increasing the demand in the transport and industrial sectors.
Therefore, the situation remains stable over time and Marginal Price convergence is very similar to 2025. With some limitations West -> East.
2040
The European gas demand decreases slightly thanks to improvement in energy efficiency. Furthermore, the further development of renewable gases allows the overall European indigenous production to reach levels similar to 2020.
East West
Marginal Prices further converge and most of the differences observed between countries reflect the transmission tariffs.
West East
The same infrastructure limitations remain between Western and Central-Eastern Europe.
North-Eastern Europe
The development of renewable gases allows the Baltic states – and Finland to a lesser extent – to have their Marginal Prices independent from Russia.
Despite the significant increase of the national production, including renewable gases; the assessment shows a significant difference between the Marginal Price in Poland and its neighbouring countries. Infrastructure shows some limitations between Poland and its neighbouring countries not accommodating with the significant increase of the Polish demand, due to the transition away from coal in power and heating sectors.
South-Eastern Europe
The same infrastructure limitations between Greece and Bulgaria are observed.
5.5.2 Low Infrastructure Level
Low infrastructure level contains list of the project that have FID status granted until the end of 2019 year. Those projects improve situation in Europe by providing new cross border capacities and other improvement of the gas systems in the Europe. Those projects are increasing possibility to follow the same gas price signals and improves convergence.
For the result evaluation it is crucial to remember that demand weighted Reference Marginal Price was calculated for Low infrastructure level separately (for each year and scenario) which means that results cannot be compared with other infrastructure level directly. Important finding from evaluation of the results is observation of convergence – not the difference of the numerical value of Marginal Price calculated for each country.
As the results for Best Estimate 2020 are not changing with the infrastructure level, following results will contain only Gas Before Coal 2025, National Trends 2030 and 2040.
Reference Supply Configuration
In the Reference gas price configuration gas prices over the Europe are not in perfect convergence. However, projects in Low infrastructure level are bringing possibility for better convergence especially in South Europe. Denmark and Sweden are having significant access to gas from national production and at the same time limited possibility to freely transfer gas with neighbouring countries in amount that will interfere with marginal prices. Finland and Estonia are having limited possibility to converge with the rest of the Europe as Baltic states are isolated.

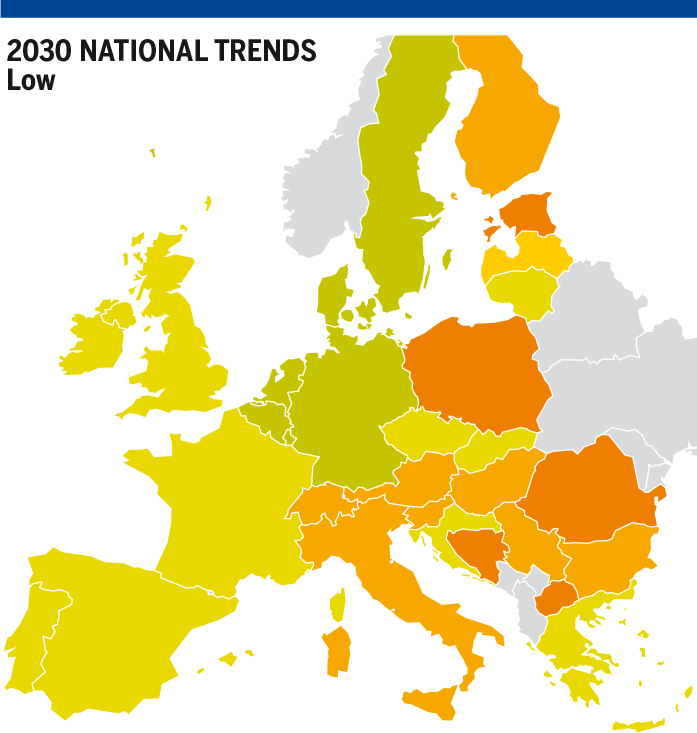
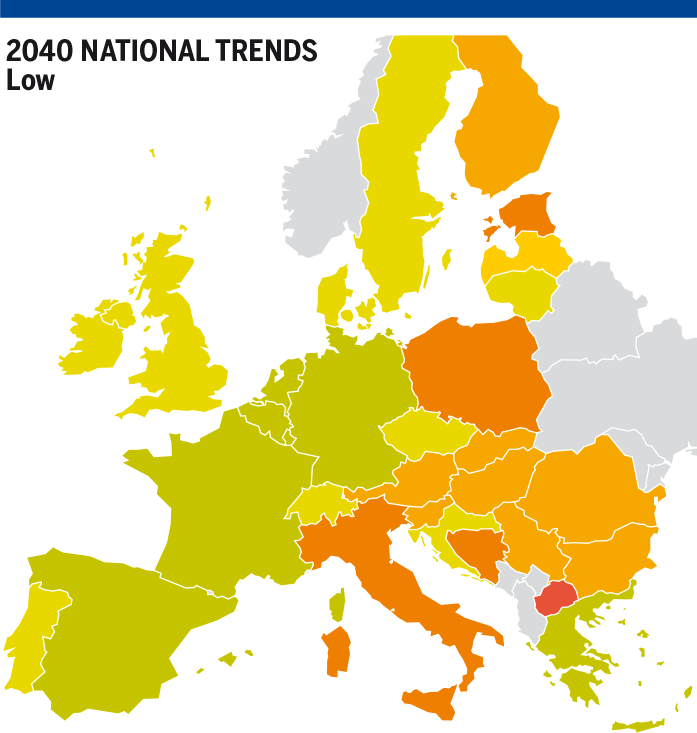
Figure 5.86: MP delta – Low infrastructure level, Reference supply configuration
LNG Max
There is limited convergence (slight improvement comparing the Reference supply price configuration) observed between Central-Eastern Europe and South Europe with Western markets in case when LNG gas price is significantly cheaper than other sources.
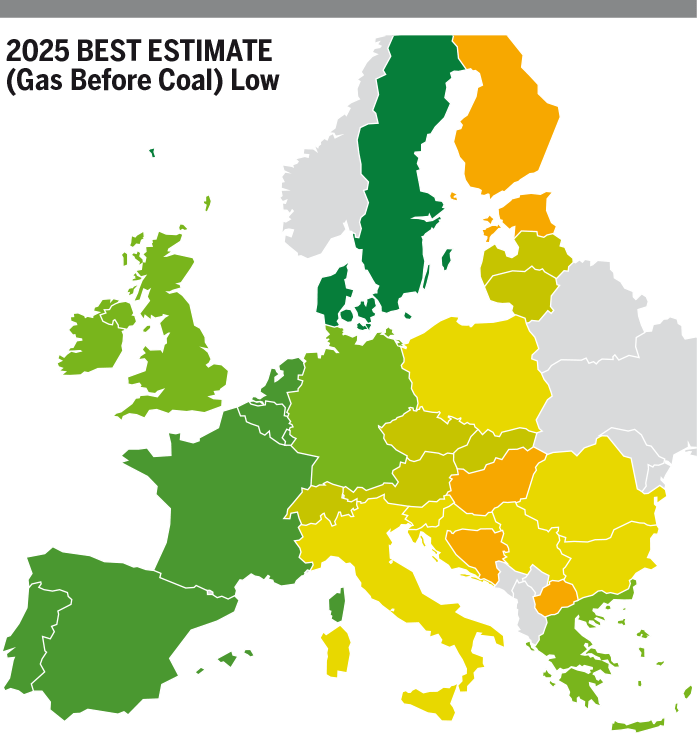
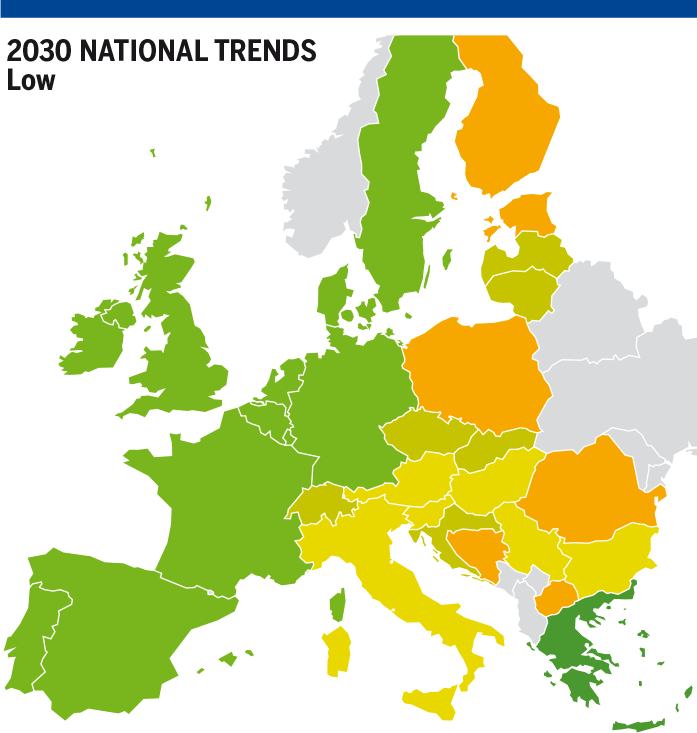
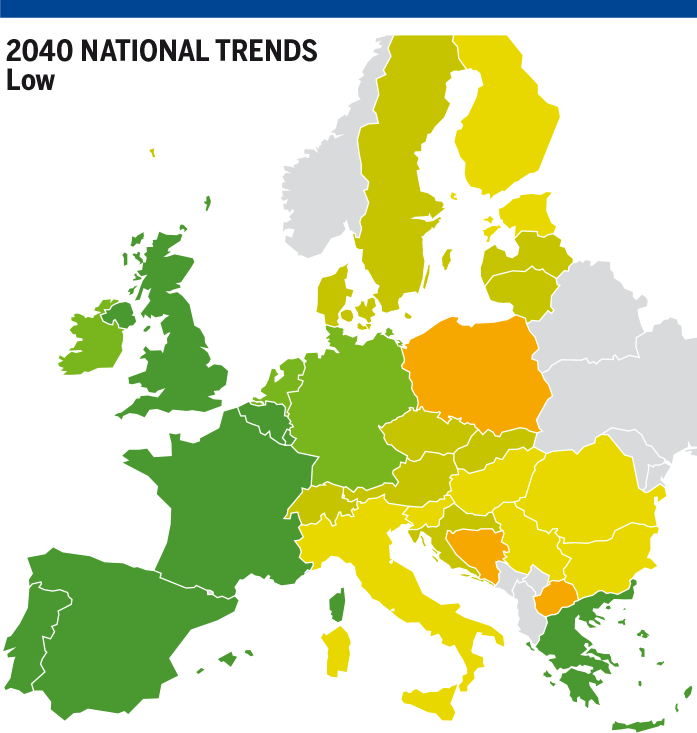
Figure 5.87: MP delta (EUR/MWh) – Low infrastructure level, LNG Max supply configuration
LNG Min
Limited convergence is observed. Denmark and Sweden are having significant access to gas from national production and at the same time limited possibility to freely transfer gas with neighbouring countries in amount that will interfere with marginal prices. Finland and Estonia are having limited possibility to converge with the rest of the Europe as Baltic states are isolated.
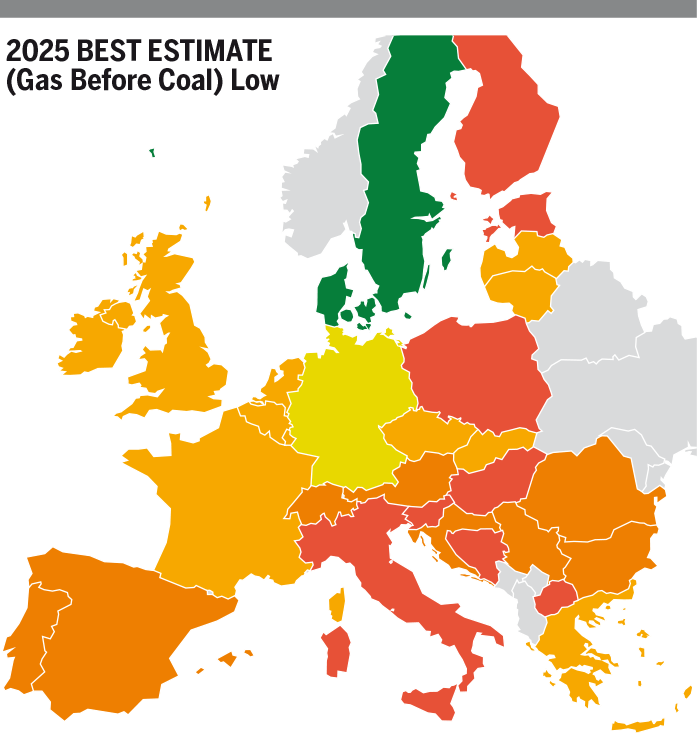
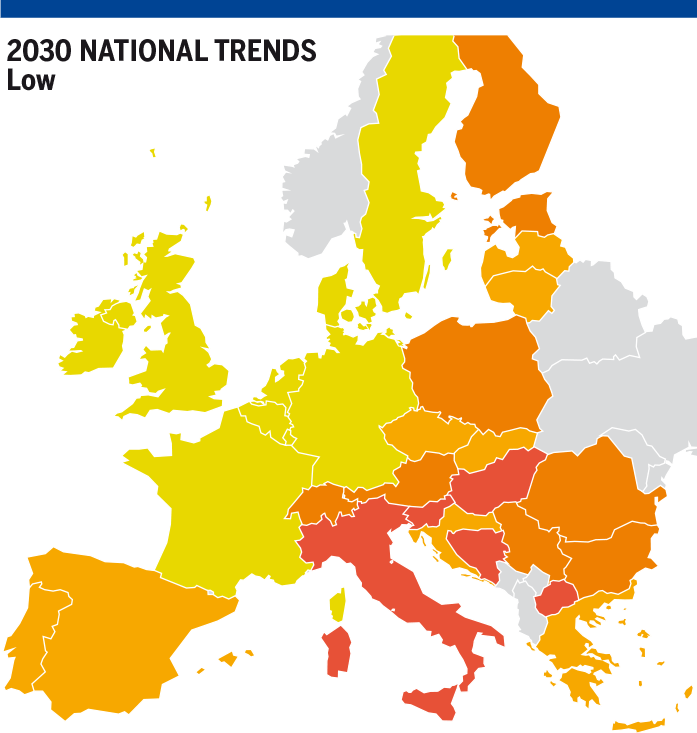
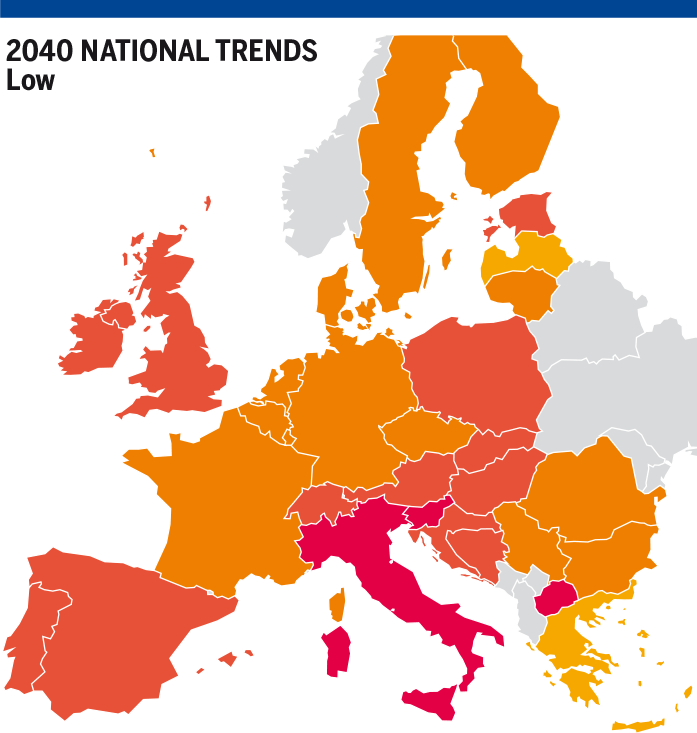
Figure 5.88: MP delta (EUR/MWh) – Low infrastructure level, LNG Min supply configuration
RU Max
The Low infrastructure level allows most of the Western and Central-Eastern and South countries to benefit of attractive prices on the same basis as countries directly supplied by Russia in National Trends 2030 and 2040.
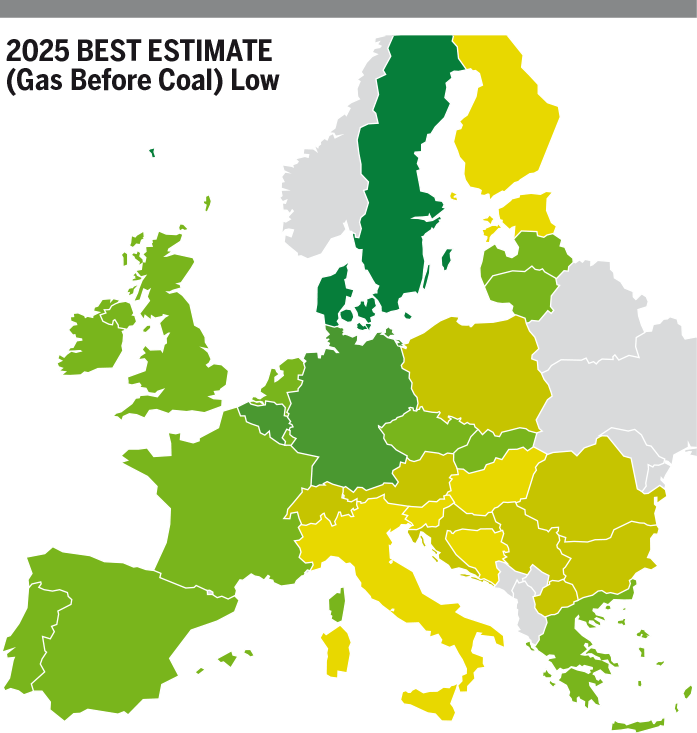
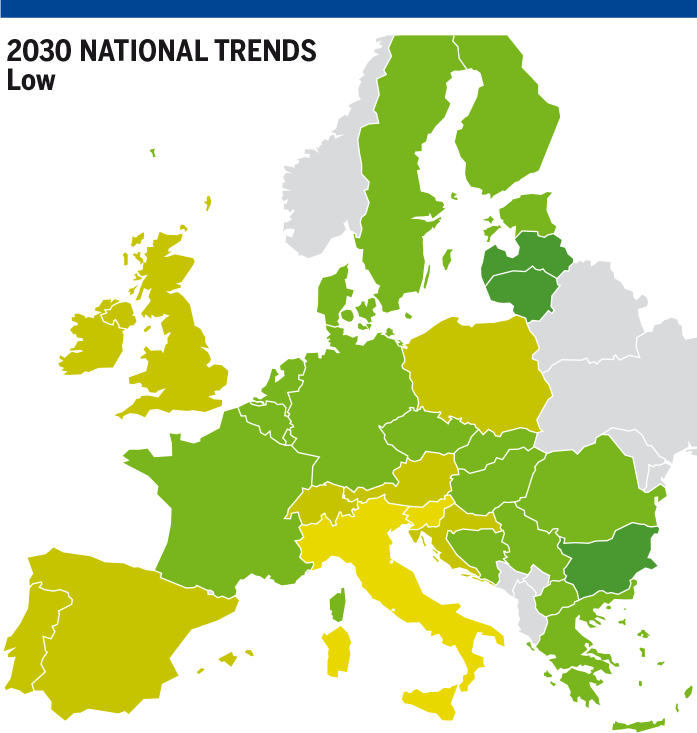
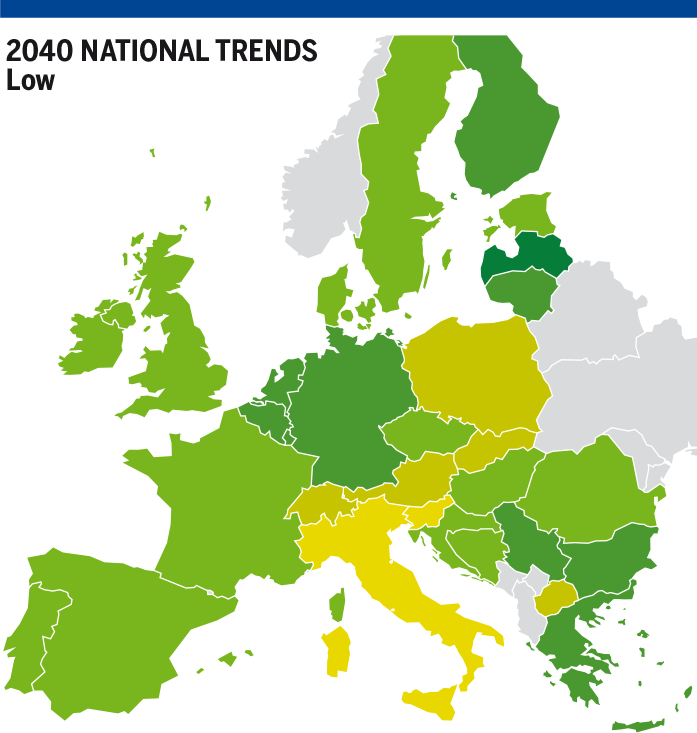
Figure 5.89: MP delta (EUR/MWh) – Low infrastructure level, RU Max supply configuration
RU Min
There is a limitation in convergence between Central-Eastern and South Europe together with Baltic states versus Western Europe. Denmark and Sweden are having significant access to gas from national production and at the same time limited possibility to freely transfer gas with neighbouring countries in amount that will interfere with marginal prices. Within regions, convergence signals are observed.
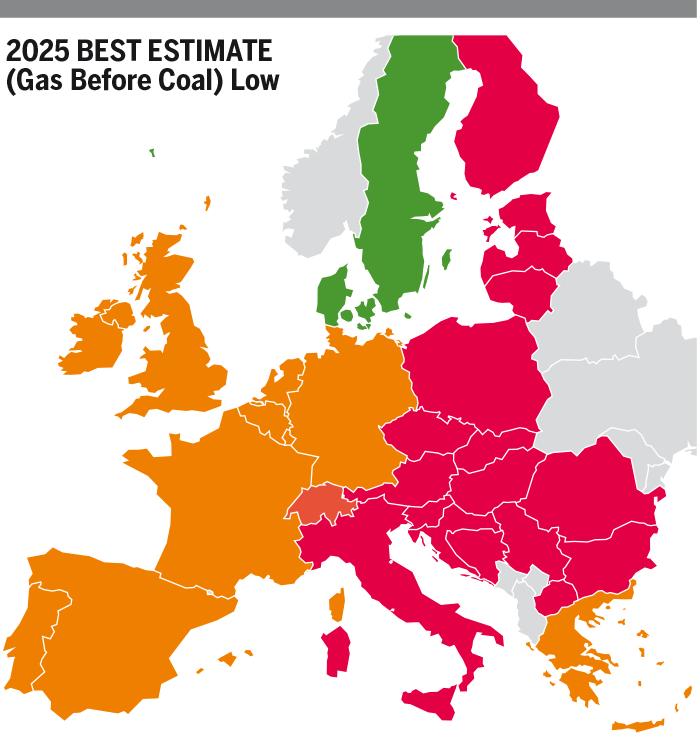
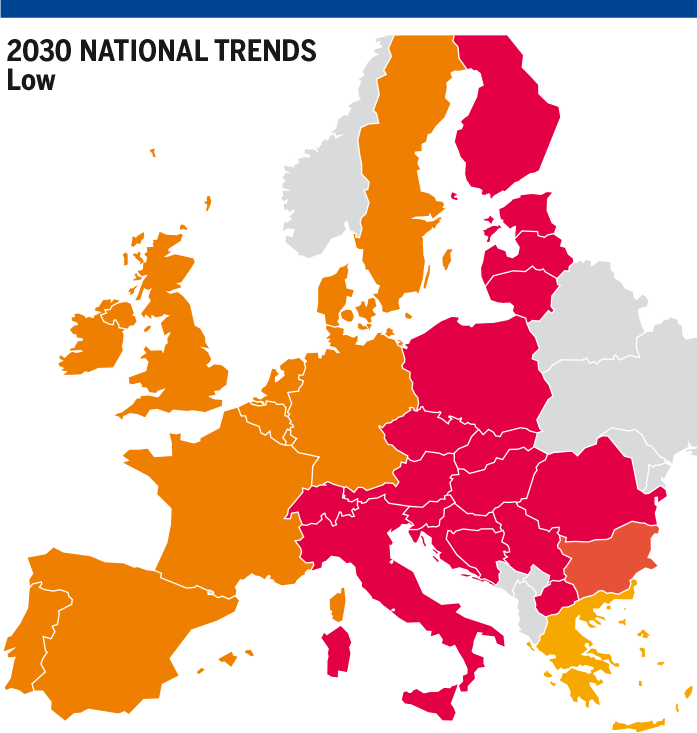
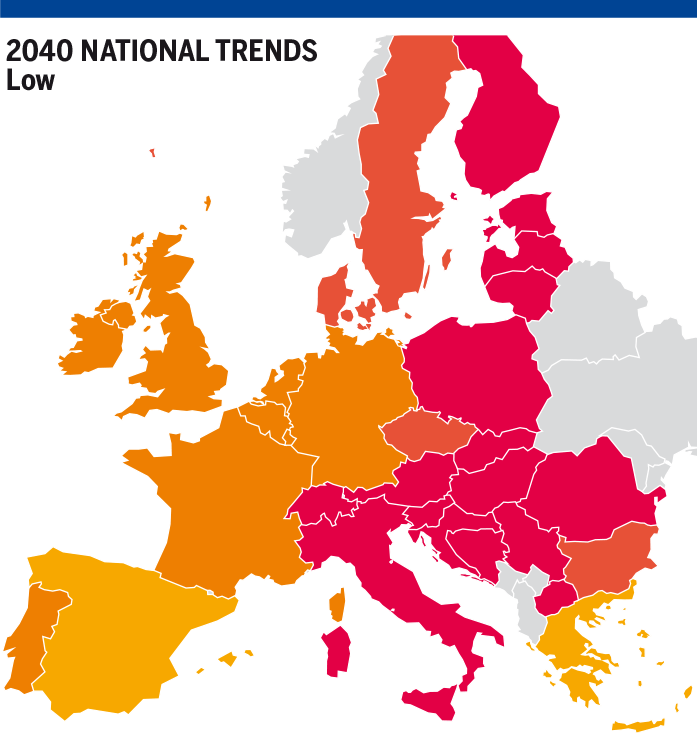
Figure 5.90: MP delta (EUR/MWh) – Low infrastructure level, RU Min supply configuration
South Max
This supply configuration is not influencing Marginal prices in Europe in context of convergence changes.
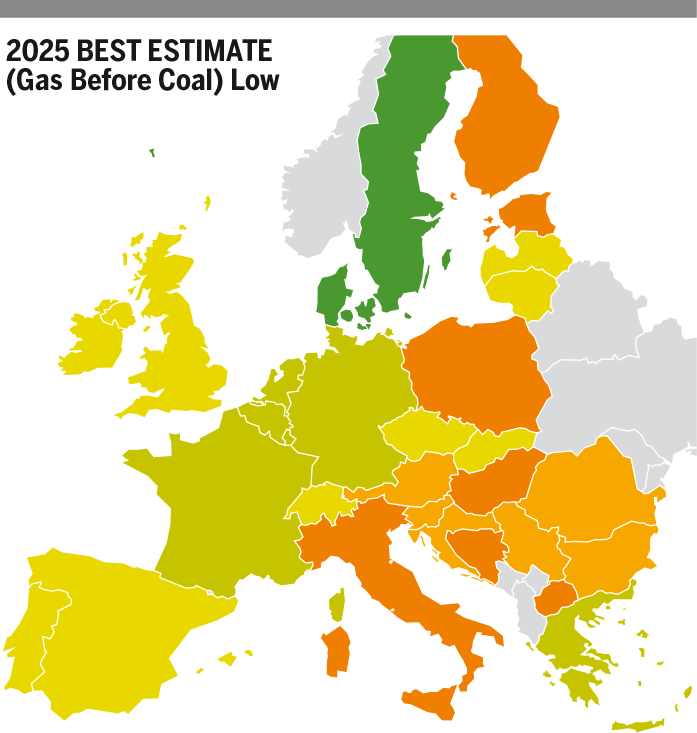


Figure 5.91: MP delta (EUR/MWh) – Low infrastructure level, South Max supply configuration
South Min
Signs of convergence are to be observed but Central-Eastern and South of Europe together with Baltic states are not converging with Western Europe.
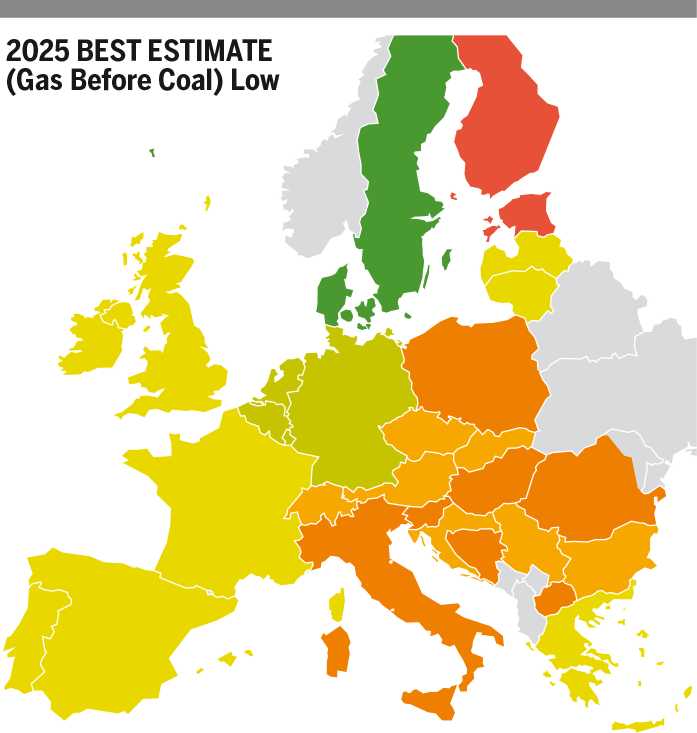
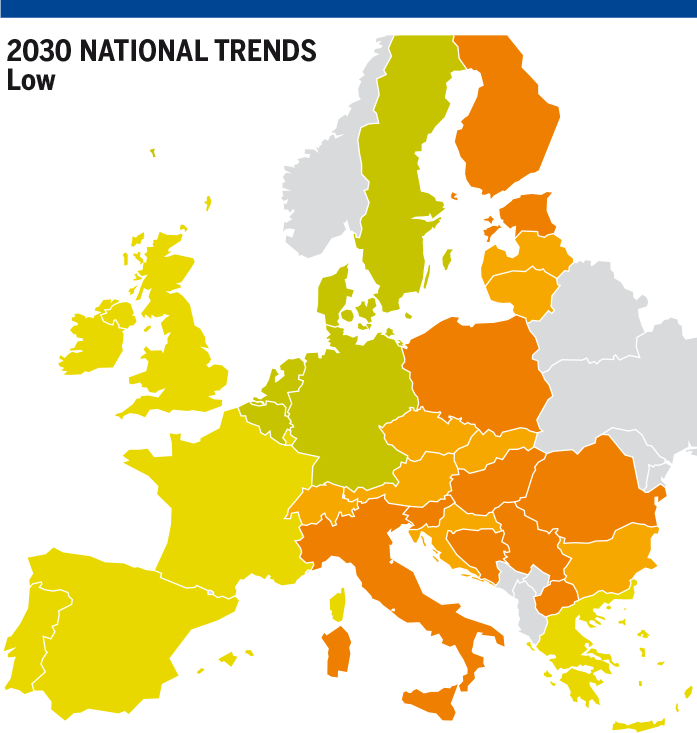
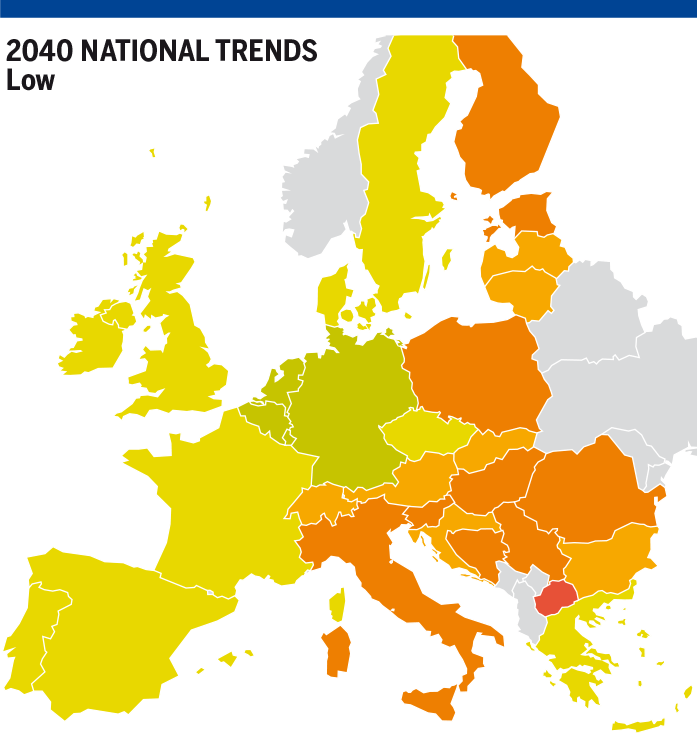
Figure 5.92: MP delta (EUR/MWh) – Low infrastructure level, South Min supply configuration
Conclusion
2025
FID projects further enhance the Marginal Price convergence between Central-Eastern Europe and the Baltic states.
However, in case of expensive Russian supply or low LNG price, the decommissioning project at the Danish-German border deteriorates the Marginal Price convergence between Denmark and Germany.
National Trends
2030 – 2040
East West
FID projects generally enhance the Marginal Price convergence in Europe, especially between Central-Eastern Europe and the Baltic states, and in the Balkan region between Bulgaria and Serbia-Bosnia.
West East
FID projects generally improve the price convergence in Eastern Europe, especially with the Baltic states. However, the main infrastructure limitations between Germany and Poland or Austria remain, with a limited improvement in 2040.
COP 21 scenarios
Distributed Energy
2030 – 2040
East West
FID projects generally enhance the Marginal Price convergence in Europe, especially between Central-Eastern Europe and the Baltic states, and in the Balkan region between Bulgaria and Serbia-Bosnia.
West East
FID projects generally improve the price convergence in Eastern Europe, especially with the Baltic states. The infrastructure limitations between Germany and Austria are mitigated and Marginal Prices converge between Germany, Czech Republic and Austria. However, infrastructure limitation between Germany and Poland remain, and marginal price differences between Austria-Czech Republic and Slovakia-Hungary reveal some remaining infrastructure limitations.
South-Eastern Europe
FID projects generally improve marginal price convergence in the region, however, they do not mitigate the infrastructure limitation between Greece and Bulgaria.
Global Ambition
2030 – 2040
East West
FID projects generally enhance the Marginal Price convergence in Europe, especially between Central-Eastern Europe and the Baltic states, and in the Balkan region between Bulgaria and Serbia-Bosnia.
West East
FID projects generally improve the price convergence in Eastern Europe, especially with the Baltic states. The infrastructure limitations between Germany and Austria are partially mitigated in 2030 and Marginal Prices convergence improve. However, other infrastructure limitations remain.
South-Eastern Europe
FID projects generally improve marginal price convergence in the region to a limited extent, however, they do not mitigate the infrastructure limitation between Greece and Bulgaria.
5.5.3 Advanced Infrastructure Level
Advanced projects are further improving the price convergence. Baltic states are connected to the rest of the Europe and new projects are allowing Denmark and Sweden to follow the same price signals.
For the result evaluation it is crucial to remember that demand weighted Reference Marginal Price was calculated for Advanced infrastructure level separately (for each year and scenario) which means that results cannot be compared with other infrastructure level directly. Important finding from evaluation of the results is observation of convergence – not the difference of the numerical value of Marginal Price calculated for each country.
Reference Supply Configuration
In Reference supply price configuration case, the advanced level is improving price convergence for all scenarios, especially in Central Eastern and South European countries.
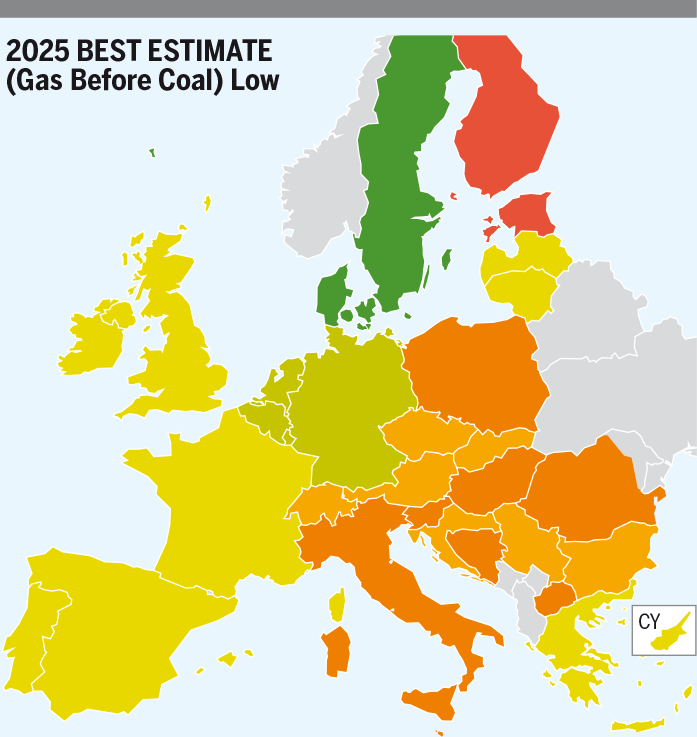
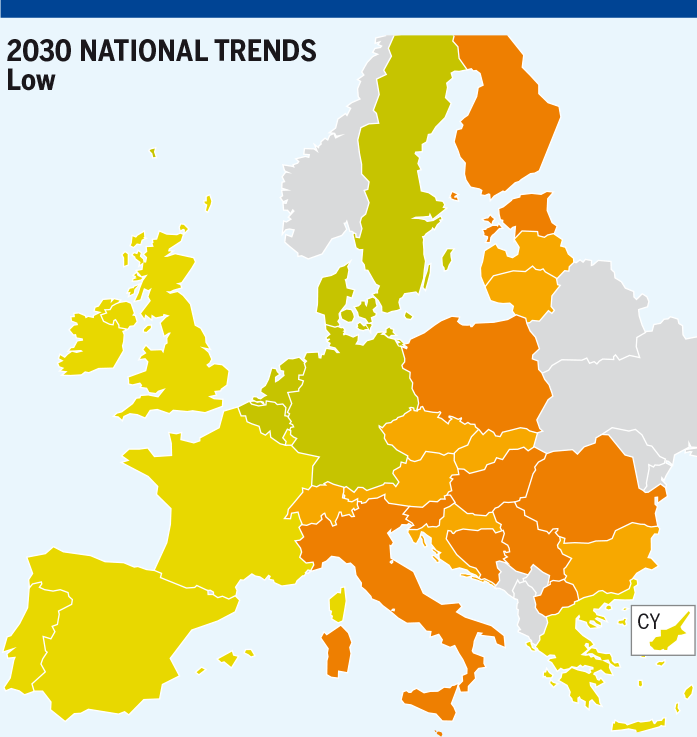
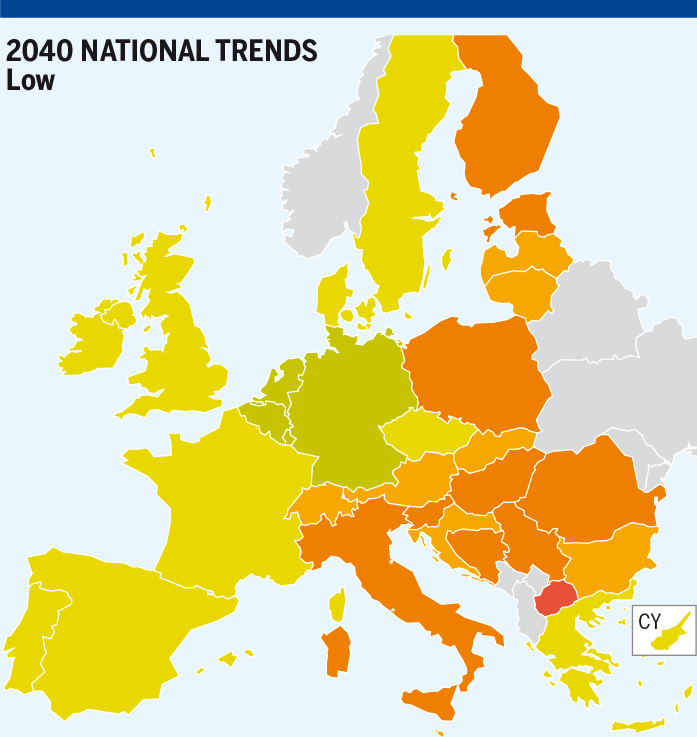
Figure 5.93: MP delta (EUR/MWh) – Advanced infrastructure level, Reference supply price configuration
LNG Max
The Advanced infrastructure level allows most of the Western and Central-Eastern and South countries to benefit of attractive prices of LNG.
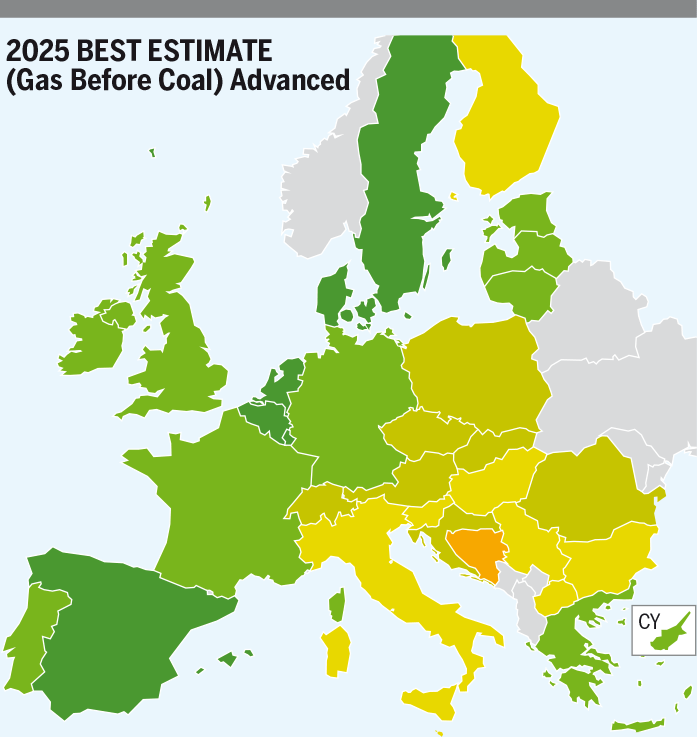
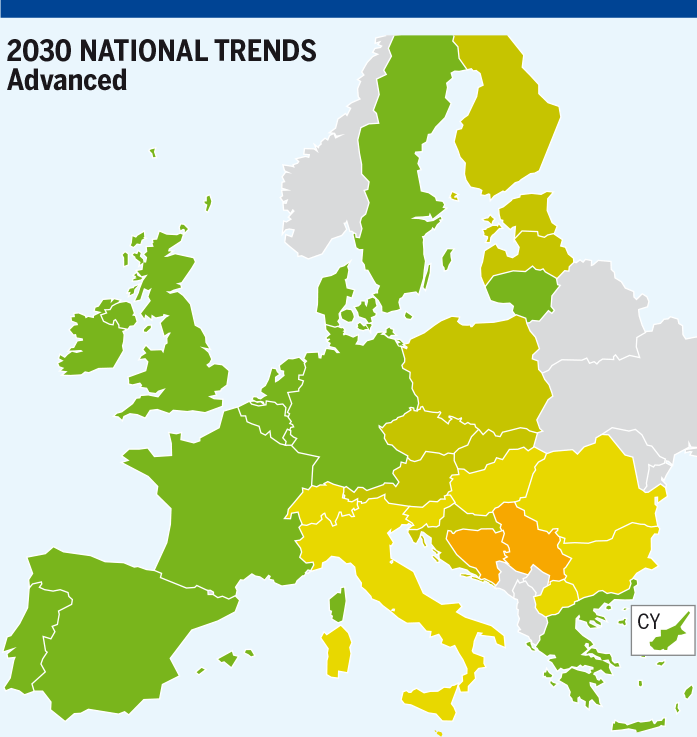
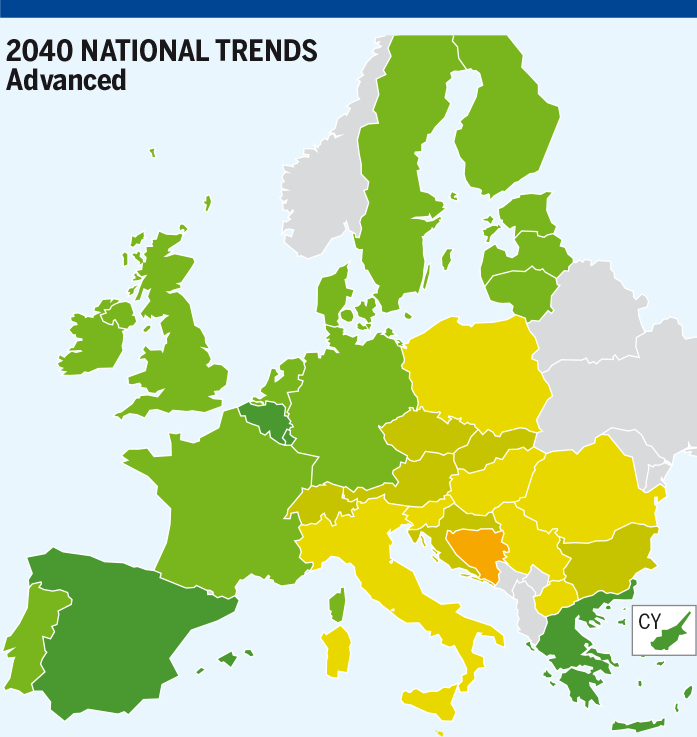
Figure 5.94: MP delta (EUR/MWh) – Advanced infrastructure level, LNG Max supply configuration
LNG Min
Limited convergence is observed in National Trends 2030 and 2040 in case of expensive LNG prices.
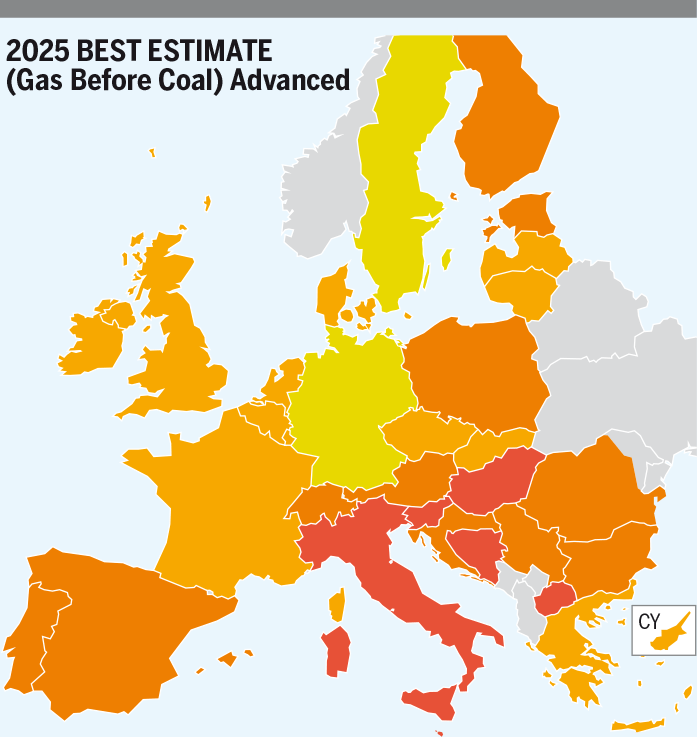
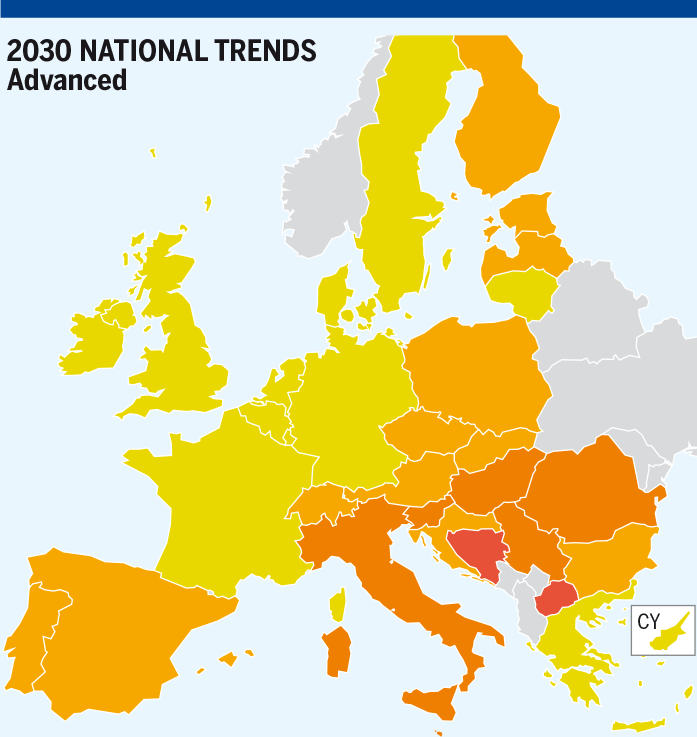
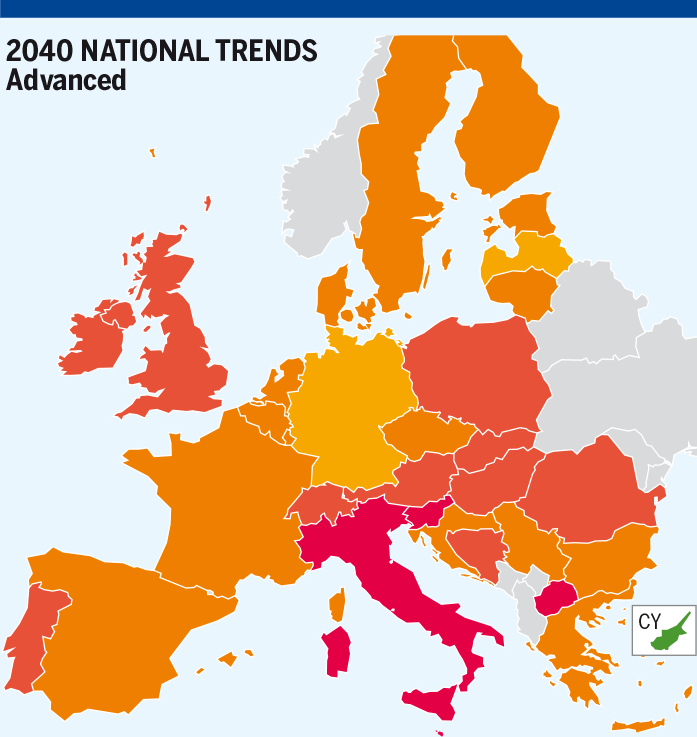
Figure 5.95: MP delta (EUR/MWh) – Advanced infrastructure level, LNG Min supply configuration
RU Max
Advanced infrastructure level allows most of the Western and Central-Eastern and South countries to benefit of attractive prices on the same basis as countries directly supplied by Russia. Differences in between countries are mostly caused by transmission tariffs.
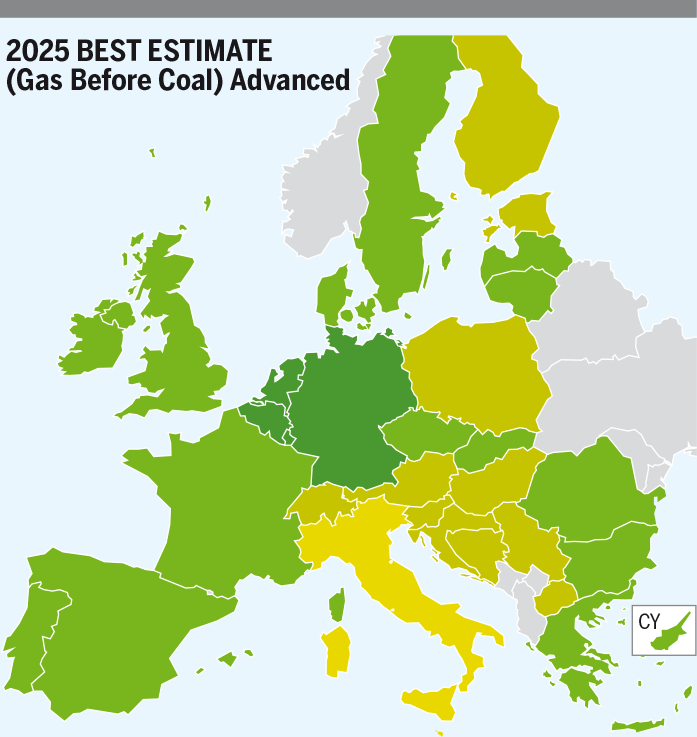
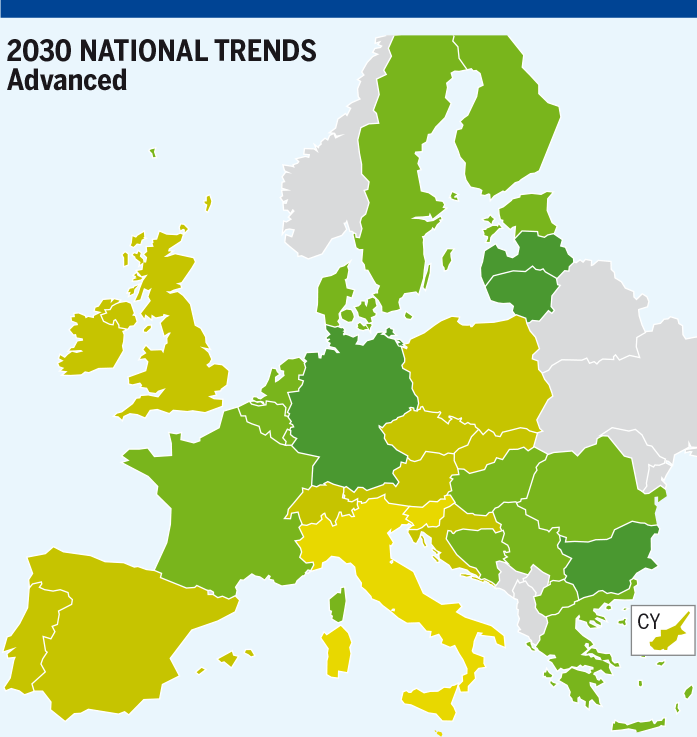
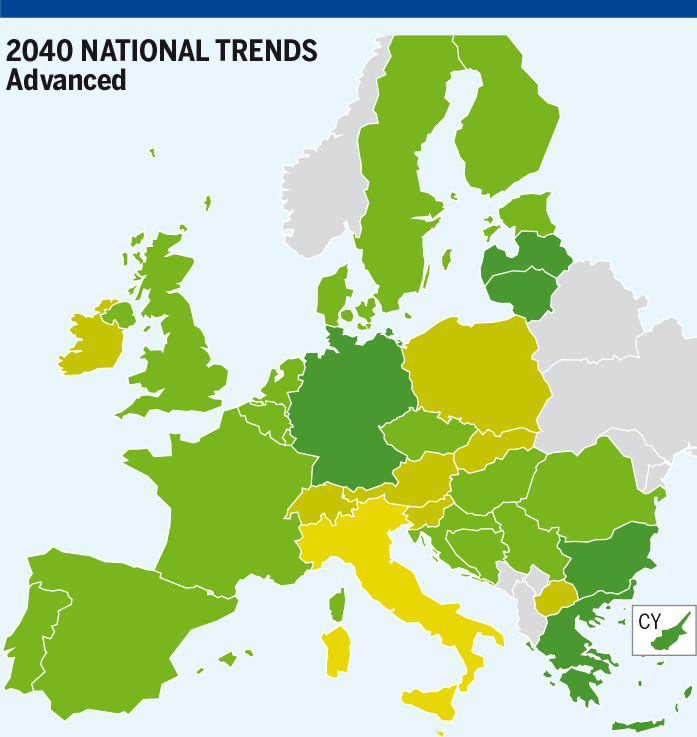
Figure 5.96: MP delta (EUR/MWh) – Advanced infrastructure level, Ru Max supply configuration
RU Min
In case of high prices of gas from Russia, European countries are converging with each other in similar way as in case of cheap gas from Russia.
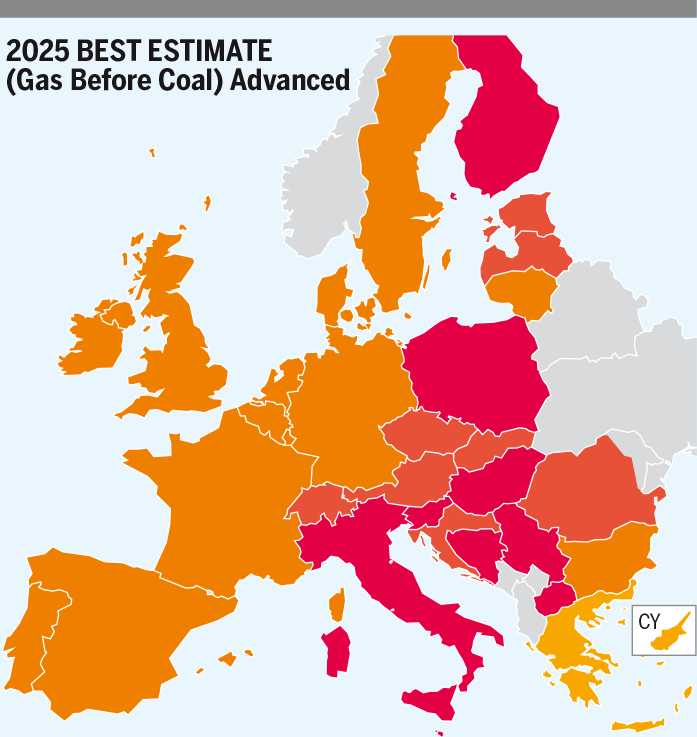
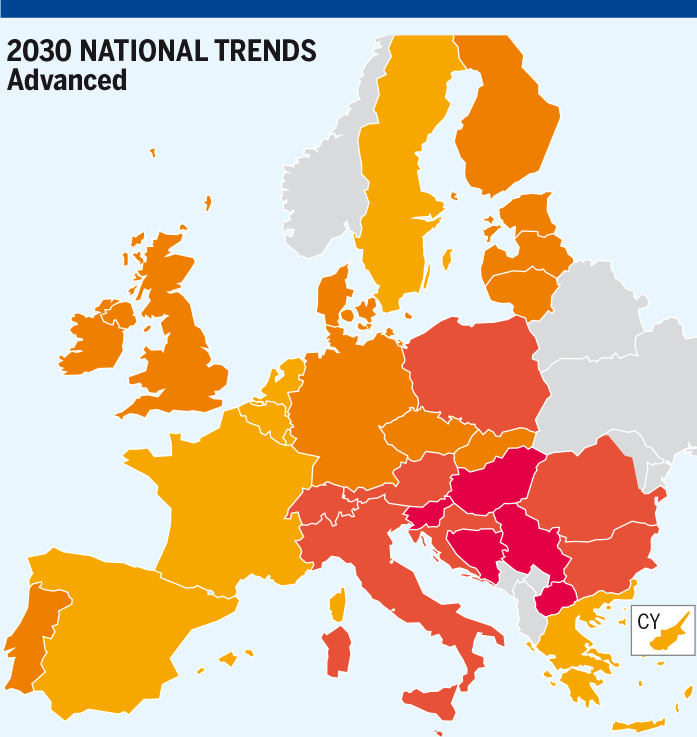
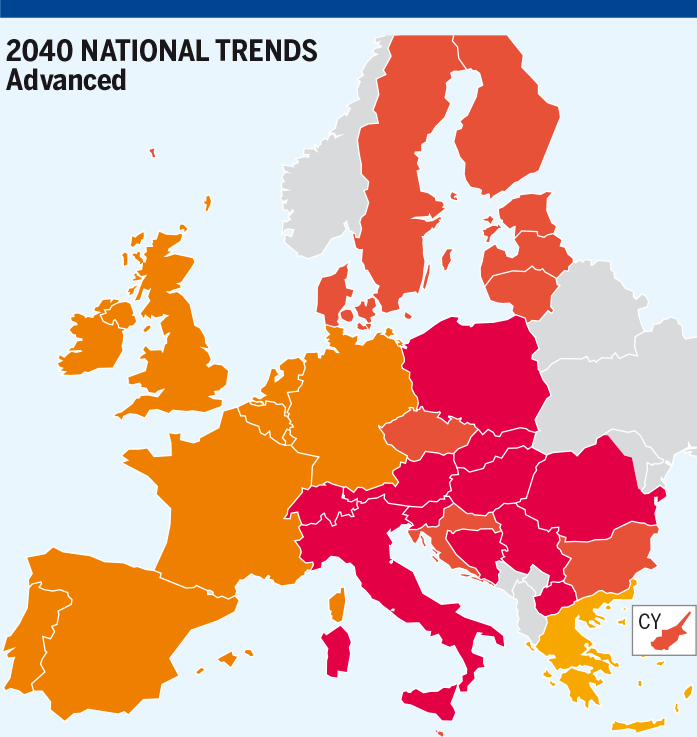
Figure 5.97: MP delta (EUR/MWh) – Advanced infrastructure level, Ru Min supply configuration
South Max
Limited improvement, in terms of convergence, provided by Advanced infrastructure level can be observed in case of preferential gas price from Southern sources.
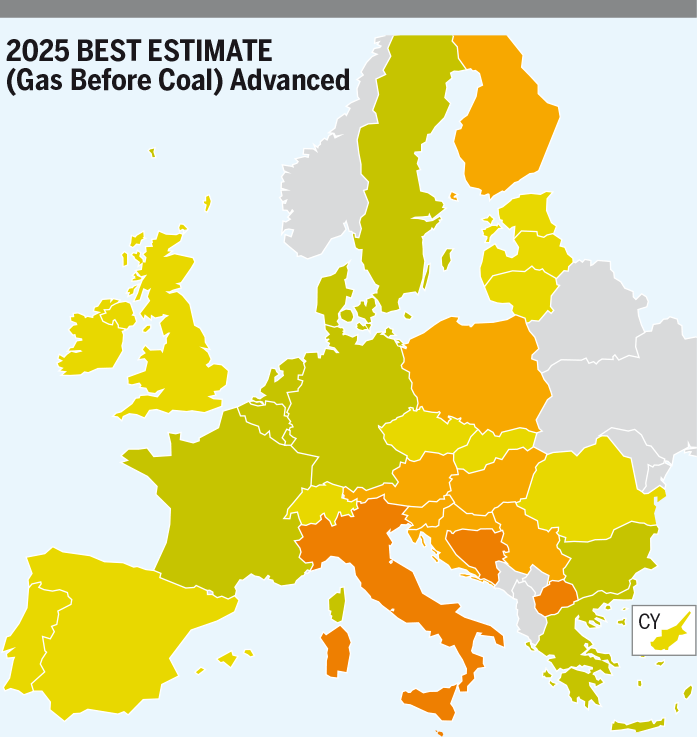
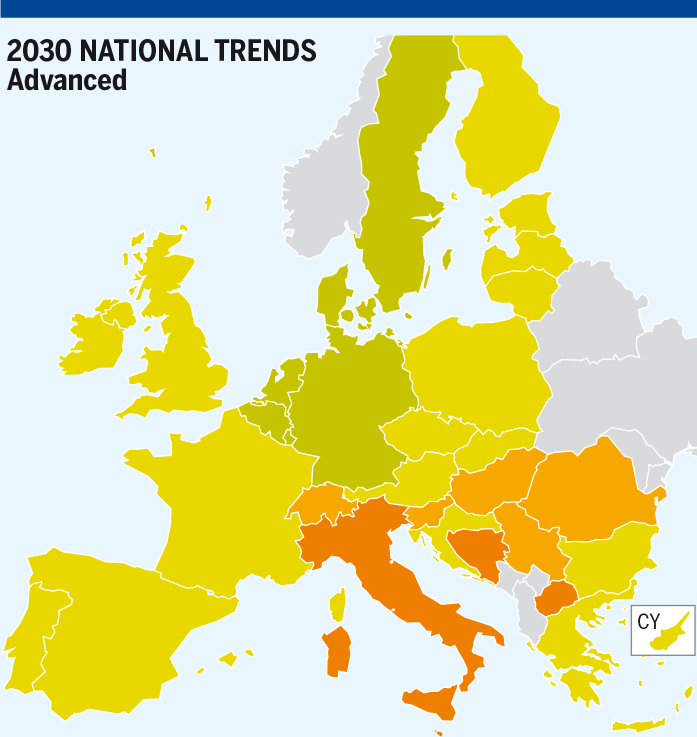
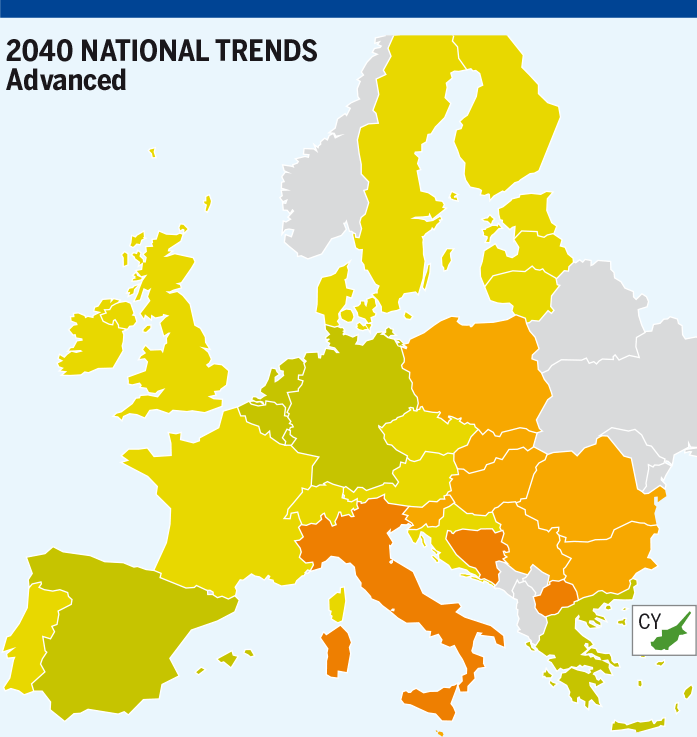
Figure 5.98: MP delta (EUR/MWh) – Advanced infrastructure level, South Max supply configuration
South Min
Central-Eastern and South Europe are showing signs of convergence in the situation of expensive gas from Southern sources, but price is not converging with Western Europe which Marginal Price is not affected by gas from this source.
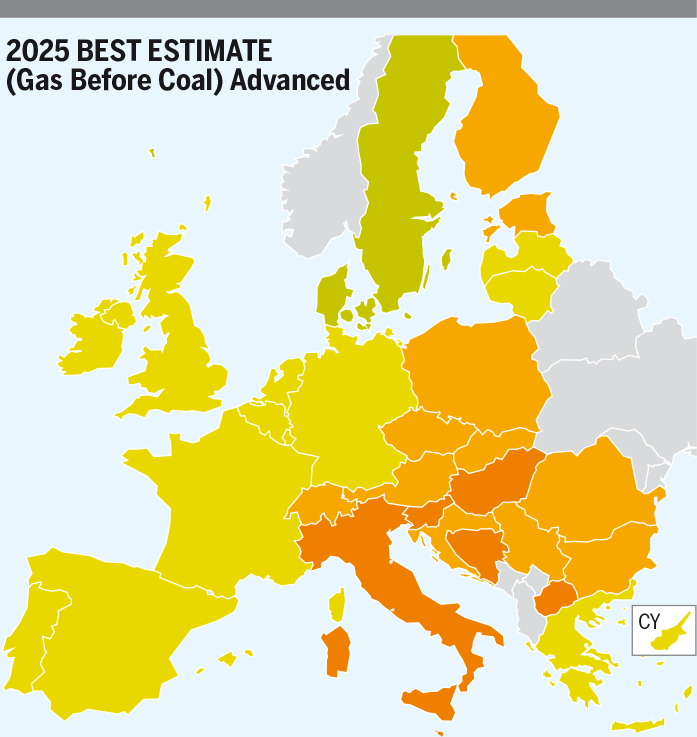
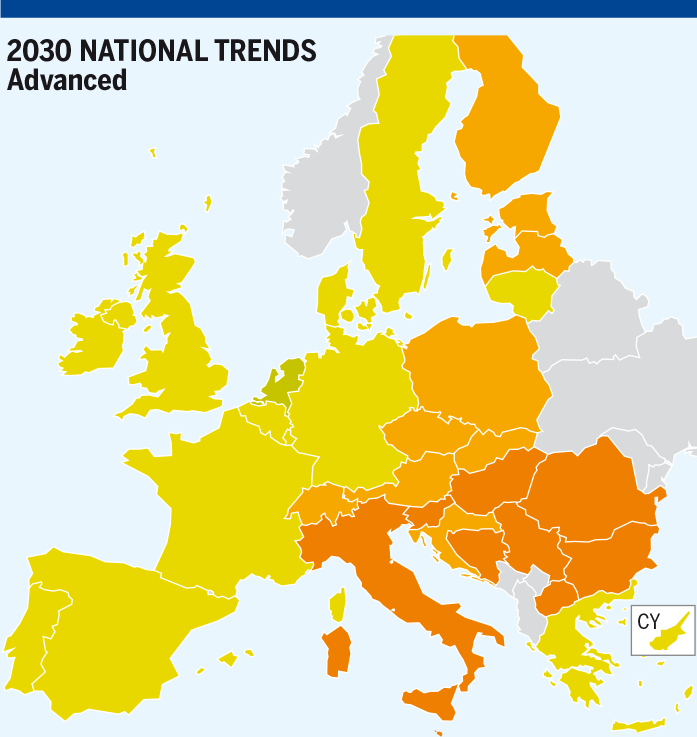

Figure 5.99: MP delta (EUR/MWh) – Advanced infrastructure level, South Min supply configuration
Conclusion
2025
Advanced projects further enhance the Marginal Price convergence in Eastern Europe, especially between Central-Eastern Europe and the Baltic states.
However, the main infrastructure limitations East -> West and West -> East remain.
National Trends
2030 – 2040
East West
Advanced projects generally enhance the Marginal Price convergence in Europe.
West East
Advanced projects significantly improve the price convergence in Europe as of 2030. However, identified limitations between Germany and Poland or Germany and Austria in the Low infrastructure level remain to a certain extent.
South-Eastern Europe
Advanced projects do not mitigate the infrastructure limitations between Greece and Bulgaria.
COP 21 scenarios
Distributed Energy
2030 – 2040
East West
Advanced projects generally enhance the Marginal Price convergence in Europe.
West East
Advanced projects significantly mitigate the West -> East infrastructure limitations and improve the price convergence all over Europe.
South-Eastern Europe
Advanced projects generally improve marginal price convergence in the region; however, they do not mitigate the infrastructure limitation between Greece and Bulgaria.
Global Ambition
2030 – 2040
East West
Advanced projects enhance the Marginal Price convergence in Europe.
West East
Advanced projects significantly mitigate infrastructure limitations in Eastern Europe. However, the infrastructure limitations West -> East remain and a misalignment of Marginal Prices between Germany and Poland or Austria can still be observed.
South-Eastern Europe
Advanced projects generally improve marginal price convergence in the region to a limited extent, however, they do not mitigate the infrastructure limitation between Greece and Bulgaria.
5.5.4 PCI Infrastructure Level
PCI infrastructure level changes situation over the Europe by introduction of wide list of the projects that are improving convergence. It is worth to mention that this is not only selection of the projects from Advanced infrastructure level with the PCI status but as well list of further projects, less mature on the date of TYNDP publication.
For the result evaluation it is crucial to remember that demand weighted Reference Marginal Price was calculated for PCI infrastructure level separately (for each year and scenario) which means that results cannot be compared with other infrastructure level directly. Important finding from evaluation of the results is observation of convergence – not the difference of the numerical value of Marginal Price calculated for each country.
Reference Supply Configuration
In Reference supply price configuration case, the advanced level is improving price convergence for all scenarios, especially in Central Eastern and South European countries.
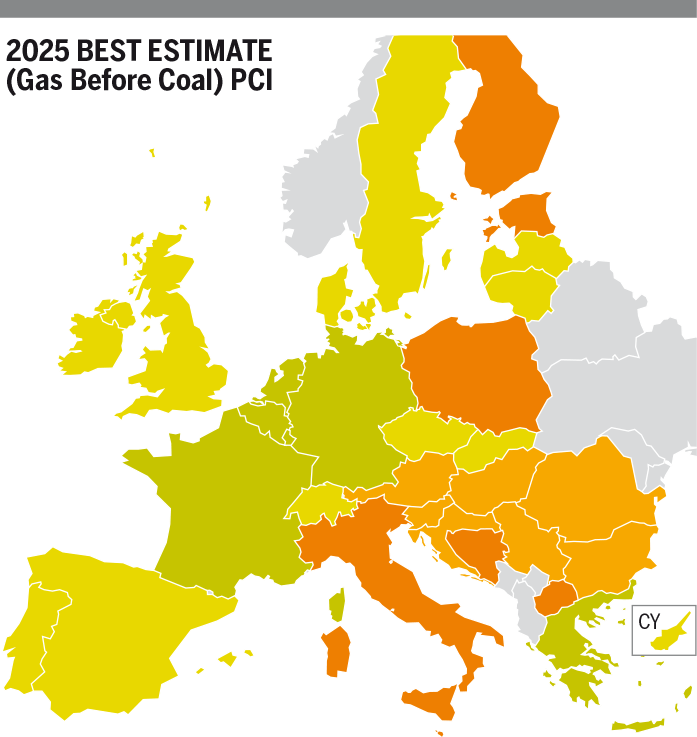
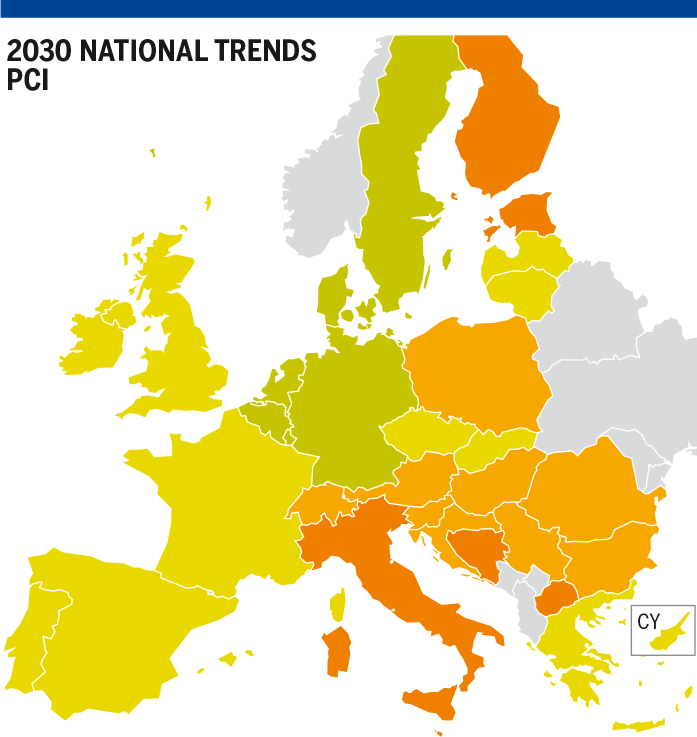
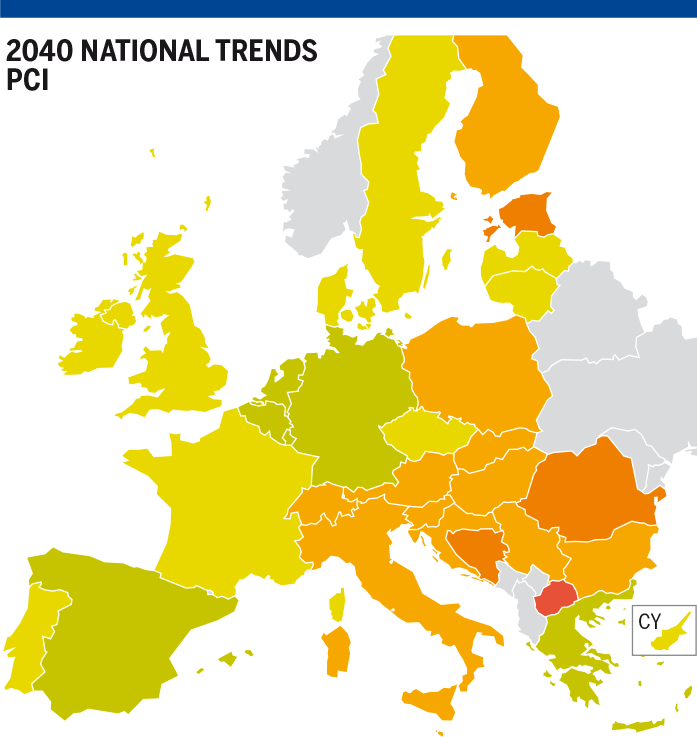
Figure 5.100: MP delta (EUR/MWh) – PCI infrastructure level, Reference supply price configuration
LNG Max
To some extend convergence can be observed between Central-East Europe, South Europe and Western Europe. With the consideration of PCI LNG terminal projects, many countries and neighbouring countries directly benefit from attractive LNG prices.
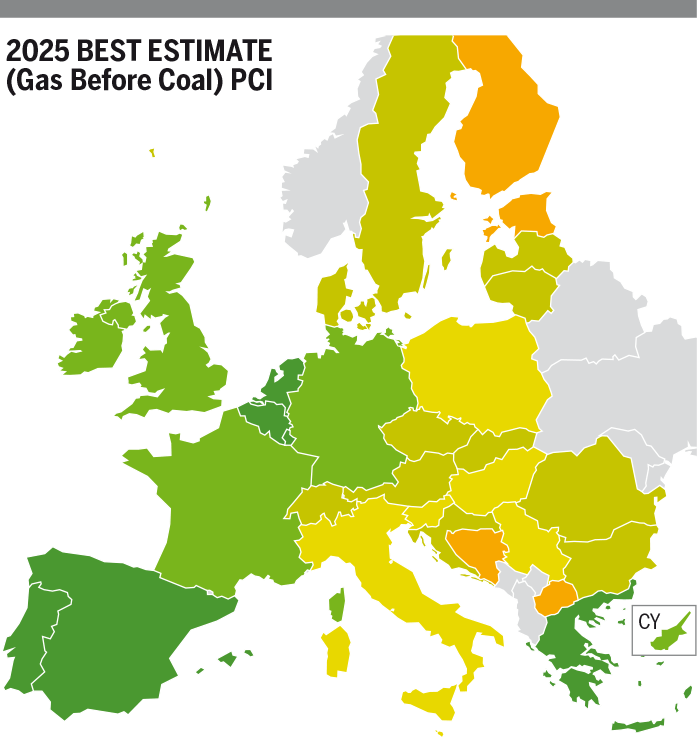
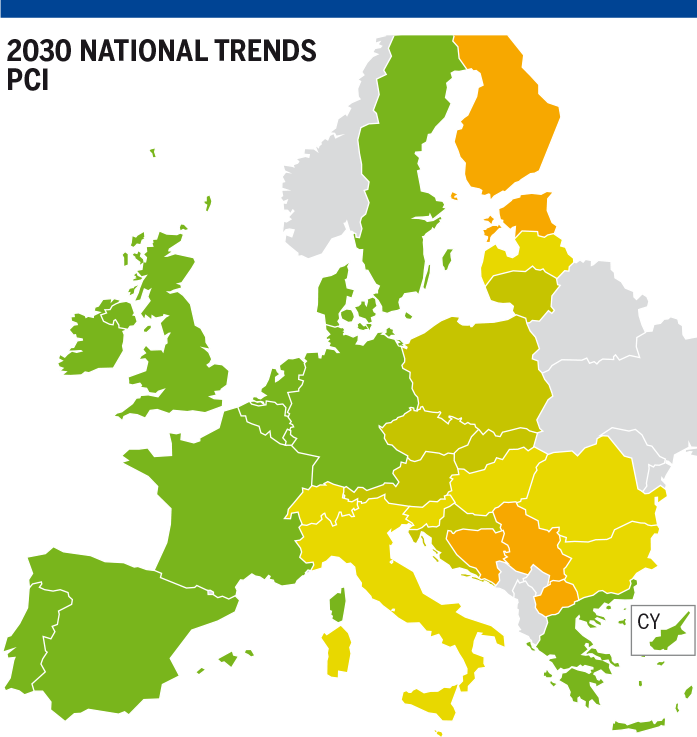
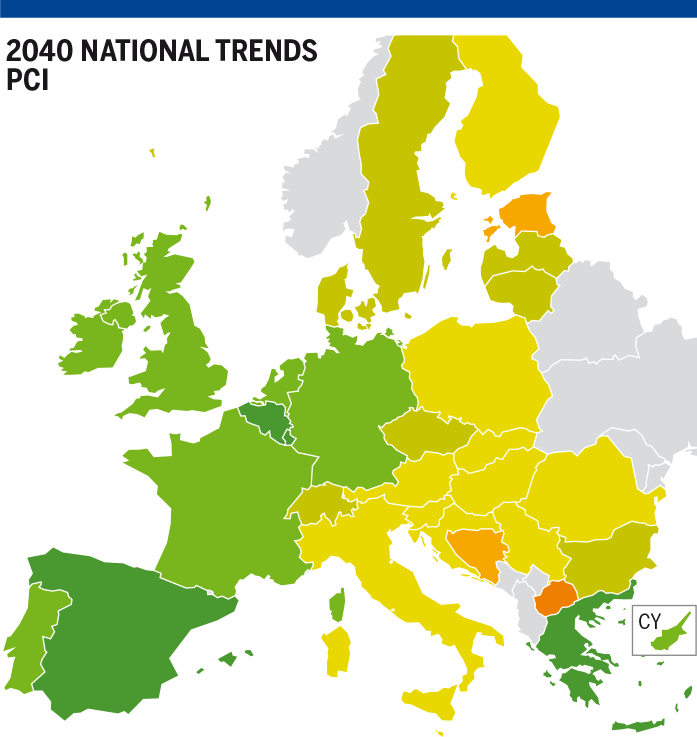
Figure 5.101: MP delta (EUR/MWh) – PCI infrastructure level, LNG Max supply configuration
LNG Min
A high LNG price can influence the marginal price in most of Europe but thanks to new layer of projects, in limited way. Limited convergence is observed in case of expensive LNG prices.
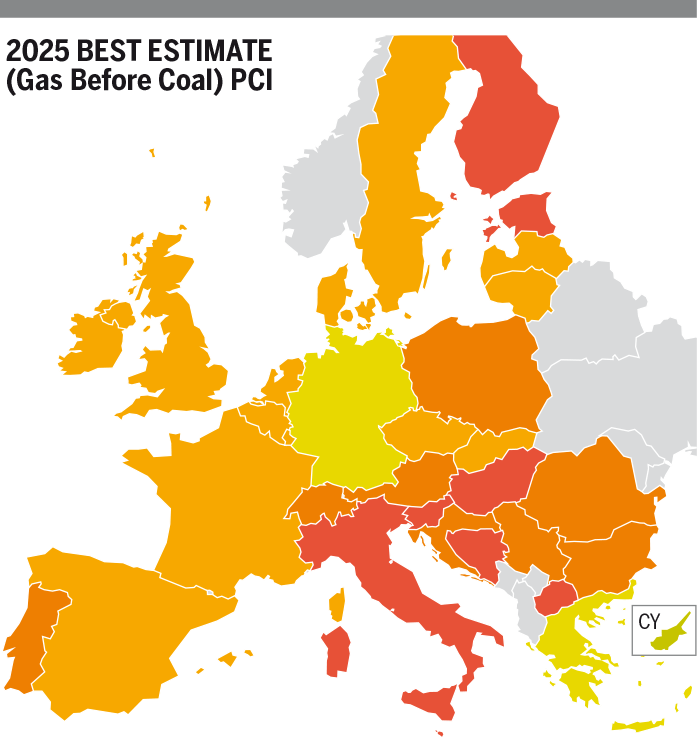
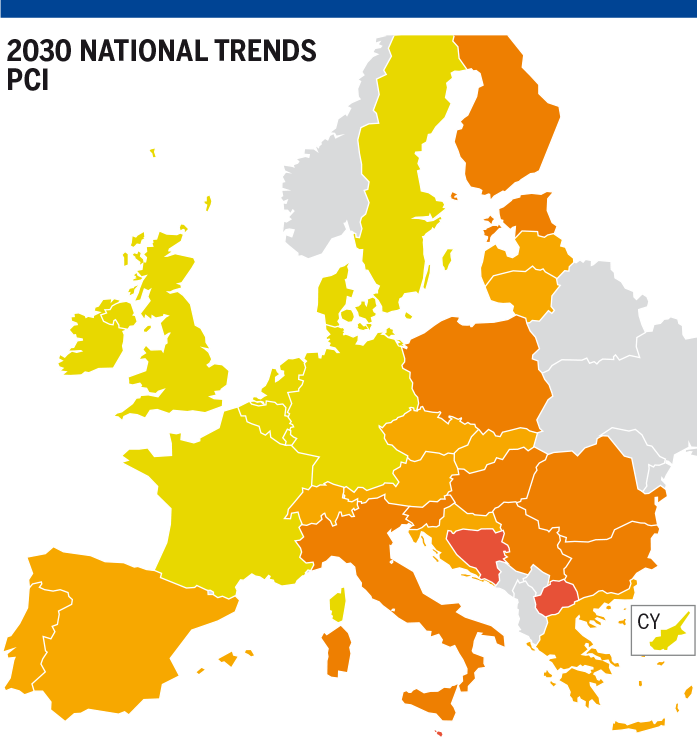
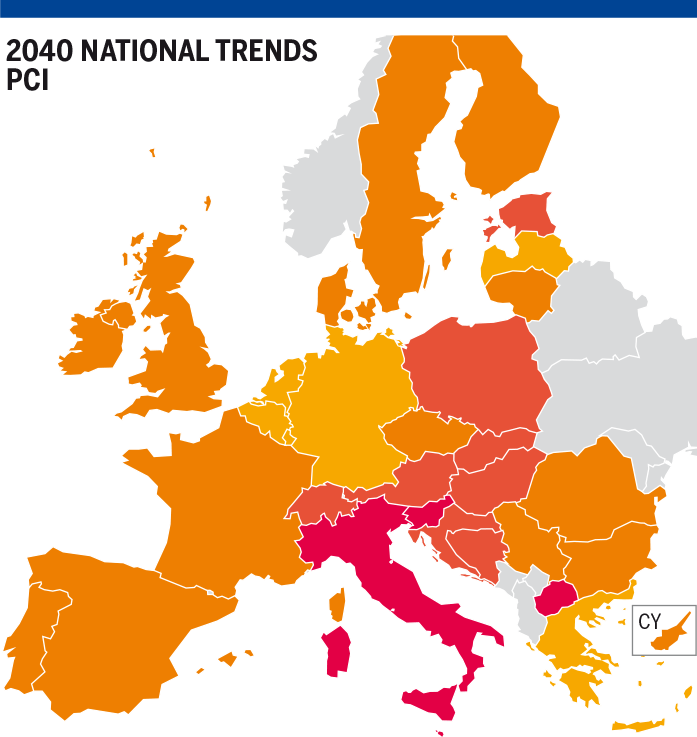
Figure 5.102: MP delta (EUR/MWh) – PCI infrastructure level, LNG Min supply configuration
RU Max
PCI infrastructure level allows most of the Western and Central-Eastern and South countries to benefit of attractive prices on the same basis as countries directly supplied by Russia. Differences in between countries are mostly caused by transmission tariffs.
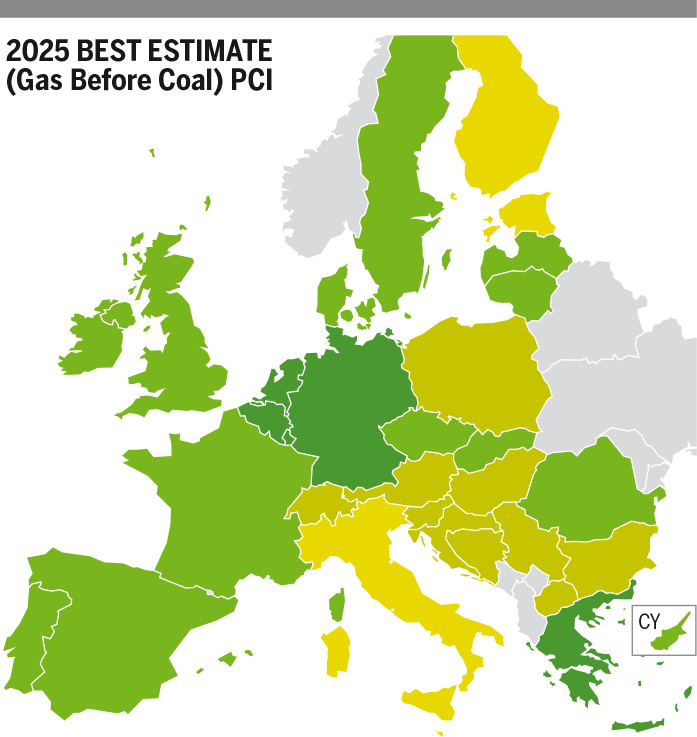
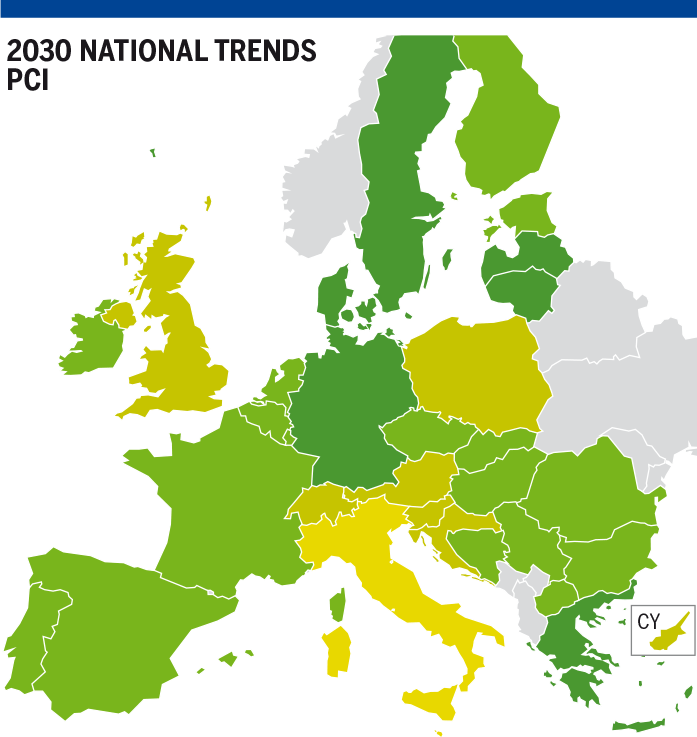
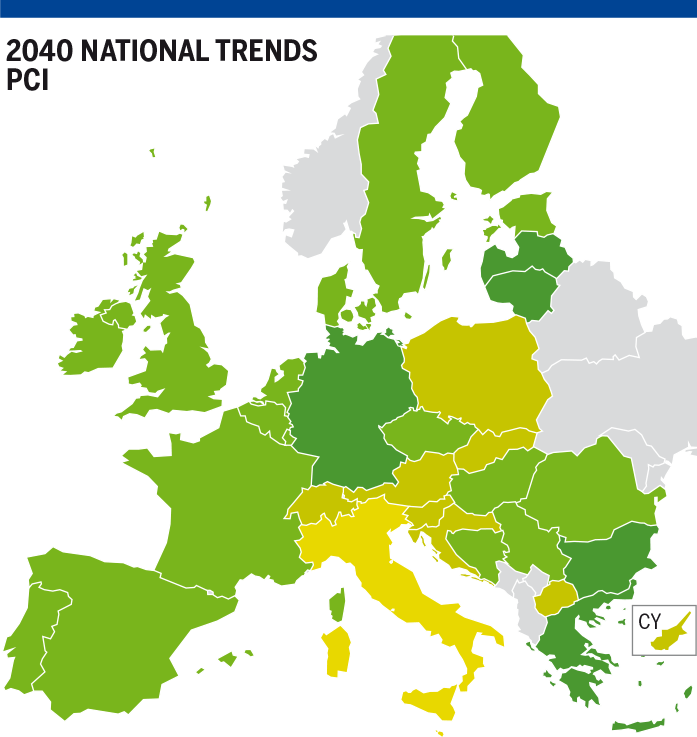
Figure 5.103: MP delta (EUR/MWh) – PCI infrastructure level, RU Max supply configuration
RU Min
In case of high prices of gas from Russia countries, Marginal Prices in countries shows similar trends as in case of cheap gas from Russia and is showing convergence.
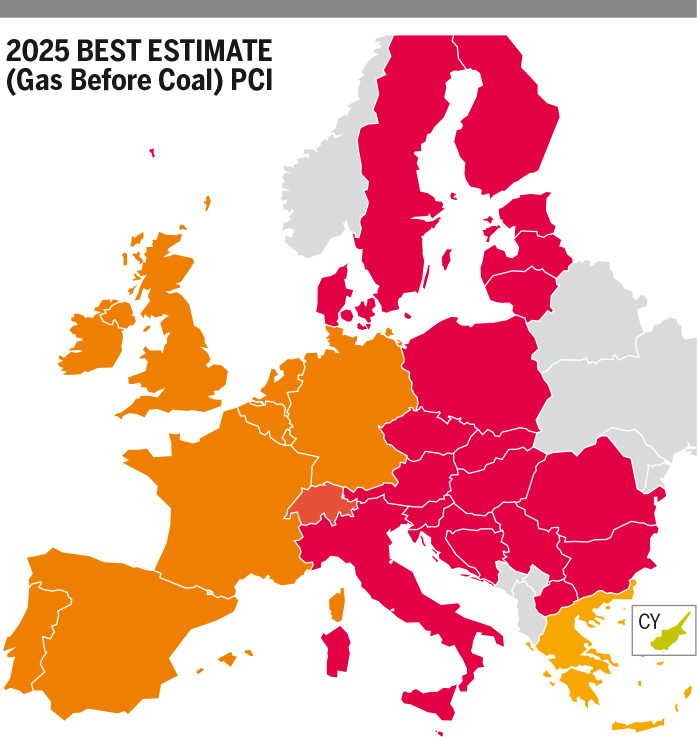
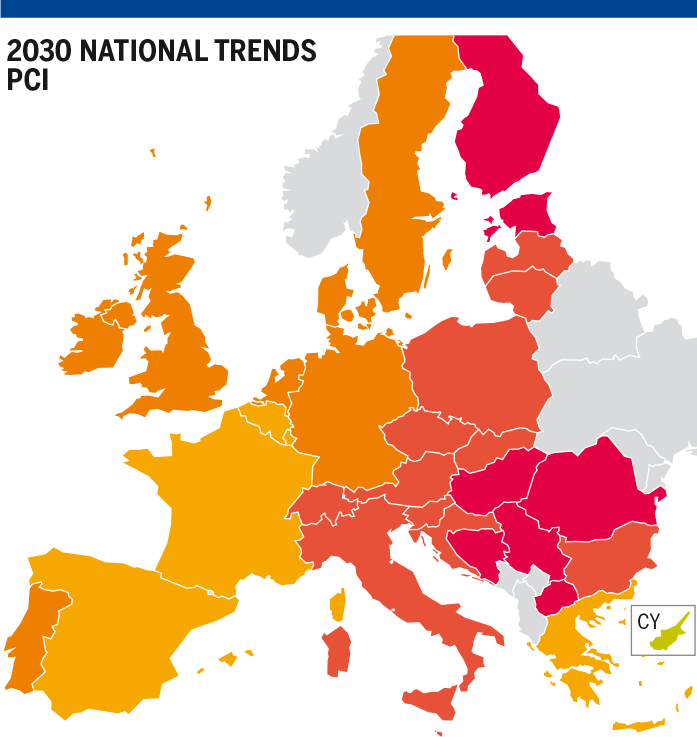
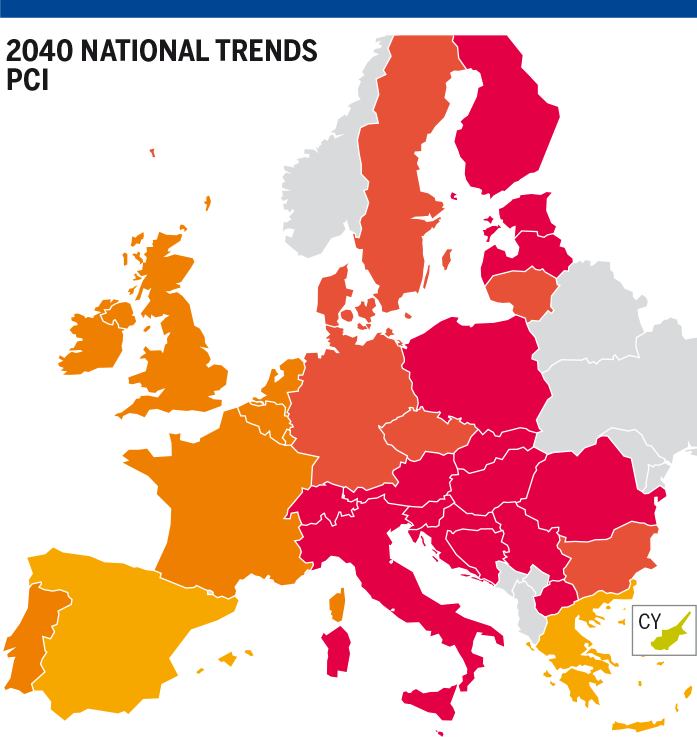
Figure 5.104: MP delta (EUR/MWh) – PCI infrastructure level, RU Min supply configuration
South Max
No significant changes observed in terms of convergence comparing to reference supply case.
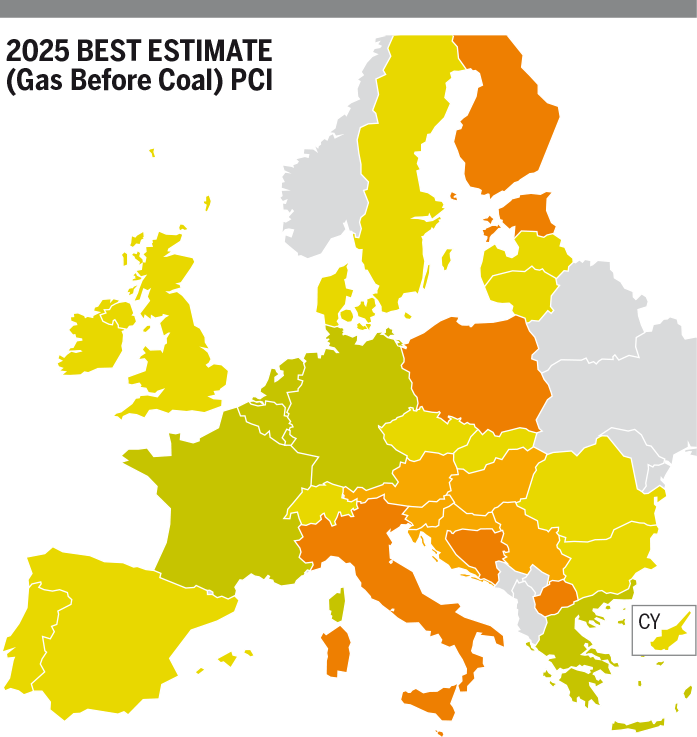
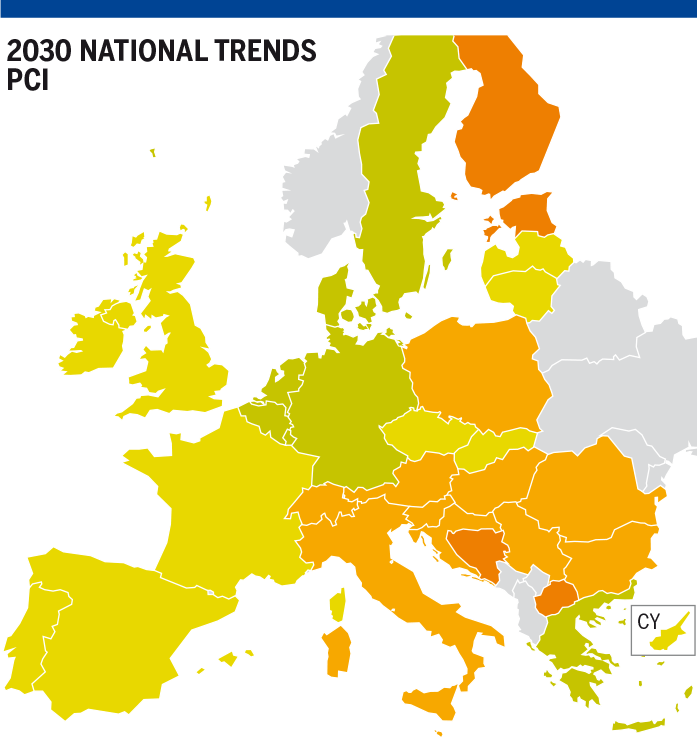

Figure 5.105: MP delta (EUR/MWh) – PCI infrastructure level, South Max supply configuration
South Min
Central-Eastern and South Europe are showing signs of convergence in the situation of expensive gas from Southern sources, but price is not converging with Western Europe which Marginal Price is not affected by gas from this source.
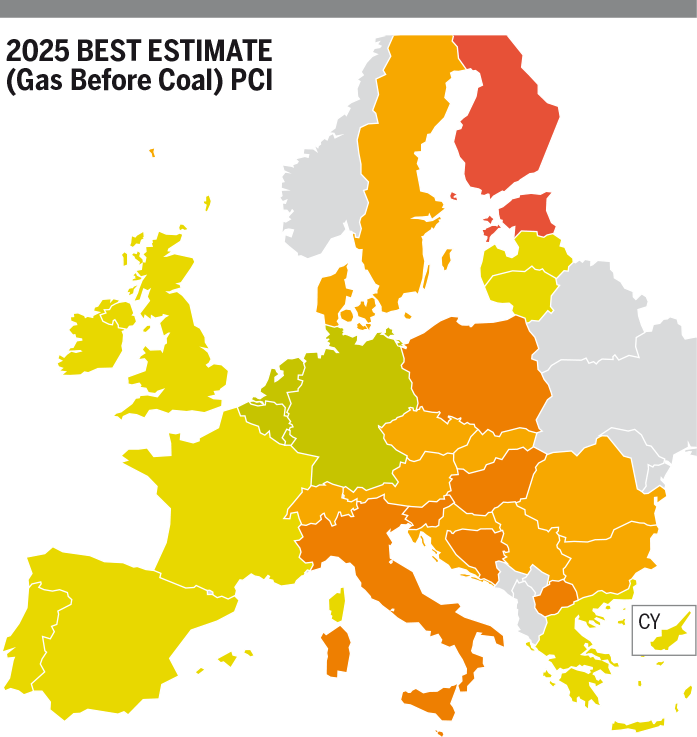
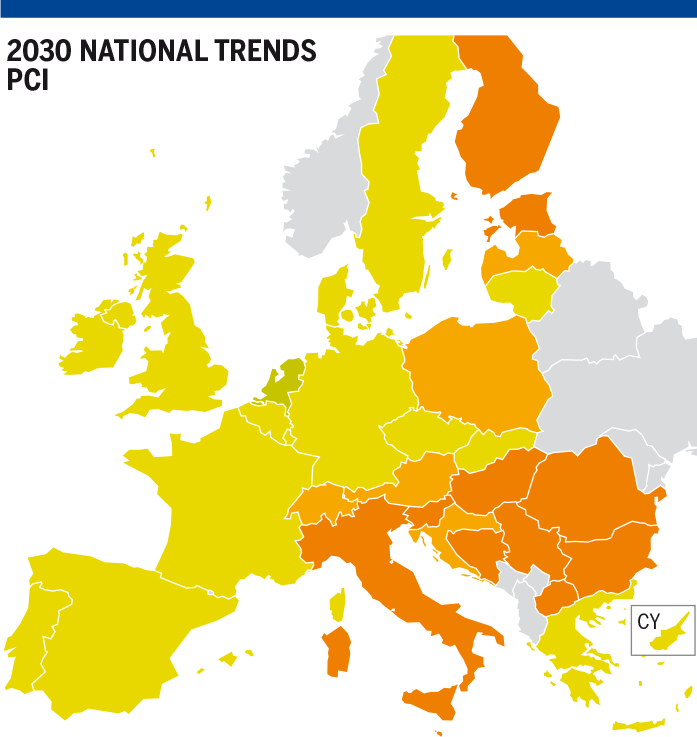
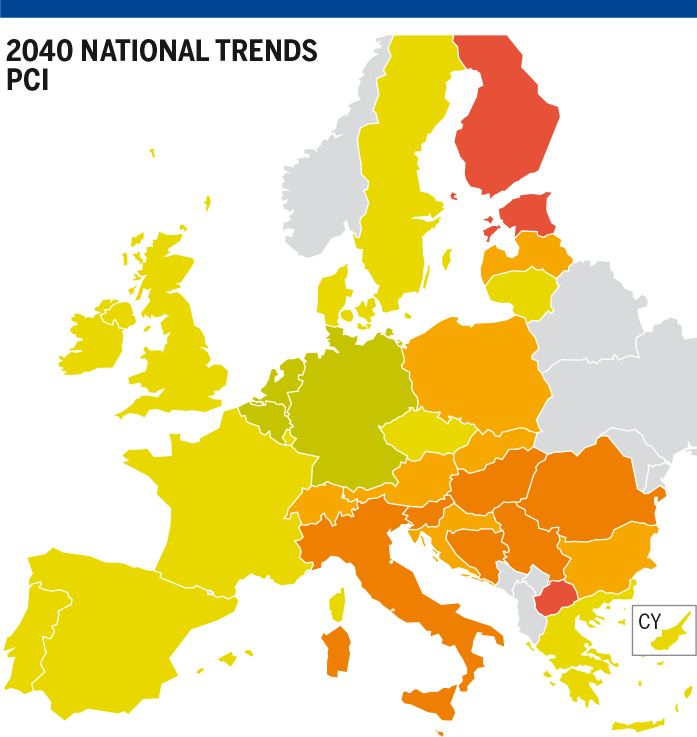
Figure 5.106: MP delta (EUR/MWh) – PCI infrastructure level, South Min supply configuration
Conclusion
2025
PCI infrastructure level projects further enhance the Marginal Price convergence in Eastern Europe.
However, the main infrastructure limitations East -> West and West -> East remain.
National Trends
2030 – 2040
East West
PCI infrastructure level projects generally enhance the Marginal Price convergence in Europe.
West East
PCI infrastructure level projects significantly improve the price convergence in Europe as of 2030. However, identified limitations between Germany and Poland or Germany and Austria in the Low infrastructure level remain to a certain extent.
South-Eastern Europe
PCI infrastructure level projects do not mitigate the infrastructure limitations between Greece and Bulgaria.
COP 21 scenarios
Distributed Energy
2030 – 2040
East West
PCI infrastructure level projects generally enhance the Marginal Price convergence in Europe.
West East
PCI infrastructure level projects significantly mitigate the West -> East infrastructure limitations and improve the price convergence all over Europe.
South-Eastern Europe
PCI infrastructure level projects generally improve marginal price convergence in the region; however, they do not mitigate the infrastructure limitation between Greece and Bulgaria.
Global Ambition
2030 – 2040
East West
PCI infrastructure level projects generally enhance the Marginal Price convergence in Europe.
West East
PCI infrastructure level projects significantly mitigate infrastructure limitations in Eastern Europe. However, the infrastructure limitations West -> East remain and a misalignment of Marginal Prices between Germany and Poland or Austria can still be observed.
South-Eastern Europe
PCI infrastructure level projects generally improve marginal price convergence in the region to a limited extent, however, they do not mitigate the infrastructure limitation between Greece and Bulgaria.