The full details of the project information included in the TYNDP 2020 can be found in Annex A of this Report. This section of the report provides a general overview of the received submissions.
5.1Type of infrastructures
Projects are classified in TYNDP 2020 according to the following infrastructure categories:
- TRA, Transmission (including Compressor Stations)
- LNG, LNG Terminal
- UGS, Underground Storage Facility
- ETR, Energy Transition projects
5.2Projects commissioned since TYNDP 2018
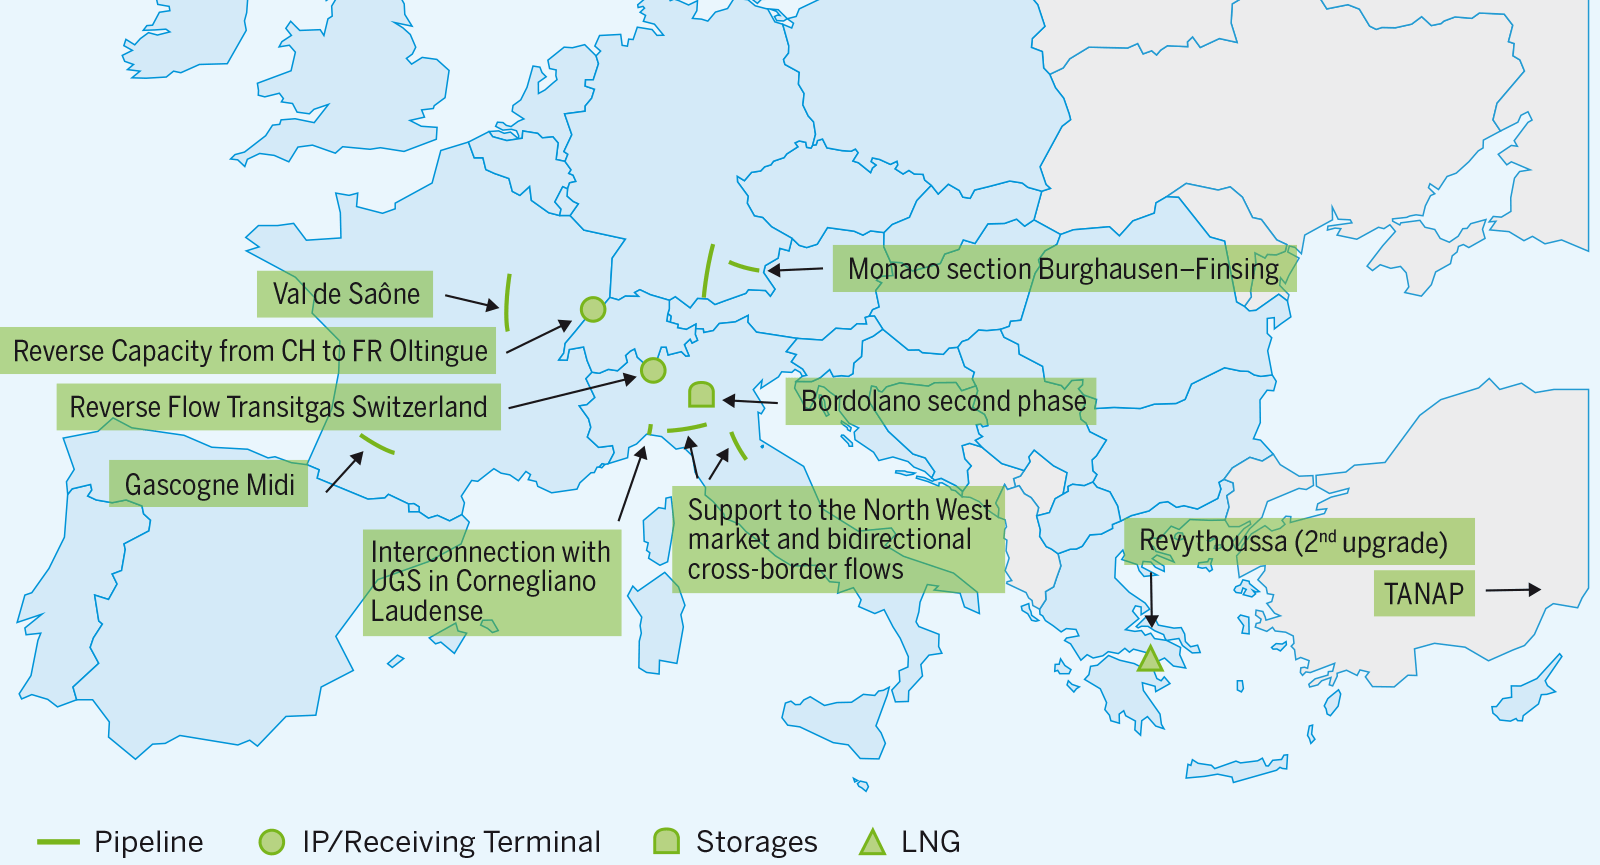
The following map shows all projects that, from the last TYNDP edition, have been completed.
10 investments already part of TYNDP 2018 were completed and have no longer been submitted to TYNDP 2020. The commissioning of all these investments further contributes to the development of the European gas system, enhancing the level of market integration, security of supply and competition.
Still, as further elaborated in the Assessment chapters, there are some areas or instances where further development of gas infrastructure is needed.
In addition to the 10 commissioned projects, 9 investments with commissioning year 2019 and 19 investments with commissioning year 2020 have been submitted to TYNDP 2020 (project collection took place between 30 May – 26 July, 2019) with the former being part of the TYNDP 2020 Existing infrastructure level. A list of these projects is presented below:
| Project code | Project name | Promoter | Country | Comissioning year |
|---|---|---|---|---|
| TRA-F-918 | Capacity4Gas – CZ/SK | NET4GAS, s.r.o. | CZ | 2019 |
| TRA-F-340 | CS Wertingen | bayernets GmbH | DE | 2019 |
| TRA-F-1267 | Upgrade Sülstorf station | NGT GmbH / GUD GmbH & Co. KG / Fluxys D GmbH | DE | 2019 |
| TRA-F-937 | Nord stream 2 | Nord Stream 2 AG | DE | 2019 |
| TRA-F-915 | Enhancement of Estonia-Latvia interconnection | Elering AS | EE | 2019 |
| ETR-F-587 | West Grid Synergy | GRTgaz | FR | 2019 |
| TRA-F-334 | Compressor station 1 at the Croation gas transmission system | Plincaro Ltd | HR | 2019 |
| TRA-F-286 | Romanian-Hungarian reverse flow Hungarian section 1st stage | FGSZ Ltd. | HU | 2019 |
| TRA-F-902 | Capacity increase at IP Lanžot entry | eustream, a.s. | SK | 2019 |
| TRA-A-1303 | IAEF – Vlora ccgt | Albgaz Sha | AL | 2020 |
| TRA-F-954 | TAG Reverse Flow | Trans Austria Gasleitung GmbH | AT | 2020 |
| TRA-F-291 | NOWAL – Nord West Anbindungsleitung | GASCADE Gastransport GmbH | DE | 2020 |
| TRA-A-951 | Embedding CS Folmhusen in H-Gas | Gasunie Deutschland Transport Services GmbH | DE | 2020 |
| TRA-F-208 | Reverse Flow TENP Germany | Fluxys TENP GmbH & Open Grid Europe GmbH | DE | 2020 |
| TRA-F-895 | Balticconnector | Elering AS | EE | 2020 |
| ETR-F-541 | CORE LNGas hive and LNGHIVE2 infrastructure and logistic solutions | Enagas Transporte S.A.U. | ES | 2020 |
| TRA-F-928 | Balticconnector Finnish part | Baltic Connector OY | FI | 2020 |
| ETR-F-546 | Jupiter 1000: first industrail demonstrator of Power to Gas in France | GRTgaz, Teréga | FR | 2020 |
| TRA-F-941 | Metering and Regulation station at Nea Messimvria | DESFA S.A. | GR | 2020 |
| TRA-F-51 | Trans Adriatic Pipeline | Trans Adriatic Pipeline AG | GR | 2020 |
| TRA-F-90 | LNG evacuation pipeline Omišalj - Zlobin (Croatia) | Plincaro Ltd | HR | 2020 |
| TRA-F-1193 | TAP interconnetion | Snam Rete Gas S.p.A. | IT | 2020 |
| TRA-F-1241 | Interconnection with production in Gela | Snam Rete Gas S.p.A. | IT | 2020 |
| TRA-F-358 | Development on the Romanian territory of the NTS (BG-RO-HU-AT) – Phase 1 | SNTGN Transgaz S.A. | RO | 2020 |
| TRA-A-1268 | Romania-Serbia Interconnection | SNTGN Transgaz S.A. | RO | 2020 |
| TRA-F-139 | Interconnection of the NTS with the DTS and reverse flow at Isaccea | SNTGN Transgaz S.A. | RO | 2020 |
| TRA-N-1064 | Moffat Physical Reverse Flow | National Grid Gas plc | UK | 2020 |
Table 1: Investments included in TYNDP 2020 whose commissioning year is 2019 or 2020
5.3Overview of the promoters’ submissions to TYNDP 2020
Project code Following the information provided by promoters, ENTSOG has aggregated the submitted investment according to a strictly functional-related criteria. For example:
- In case of an interconnector connecting two (or more) countries, two (or more) different promoters are usually involved;
- A new LNG terminal or storage may need a new evacuation pipeline to connect them to the gas network and in some cases the two investments might be promoted by different entities;
- In some cases, projects connecting the EU to new supply sources are actually composed by different projects (and in some cases promoted by different subjects) whose full realisation is a prerequisite to connect the new source.
In all above cases, investments carried on by different promoters need to be implemented together for the overall project to materialise. It makes therefore sense to consider them as a single “aggregated” project. This aggregation represented also a useful basis for the identification of project groups on which the project-specific cost-benefit analysis has been performed.
Based on this, for TYNDP 2020 promoters submitted 142 gas infrastructure projects (excluding ETRs) i. e. transmission, UGS and LNG projects. In TYNDP 2018 promoters submitted 155 gas infrastructure projects. In addition, a number of 68 Energy Transition projects have been included in TYNDP thus reaching a total number of 210 projects included in TYNDP 2020.
5.3.1 Transmission projects (including compressor stations)
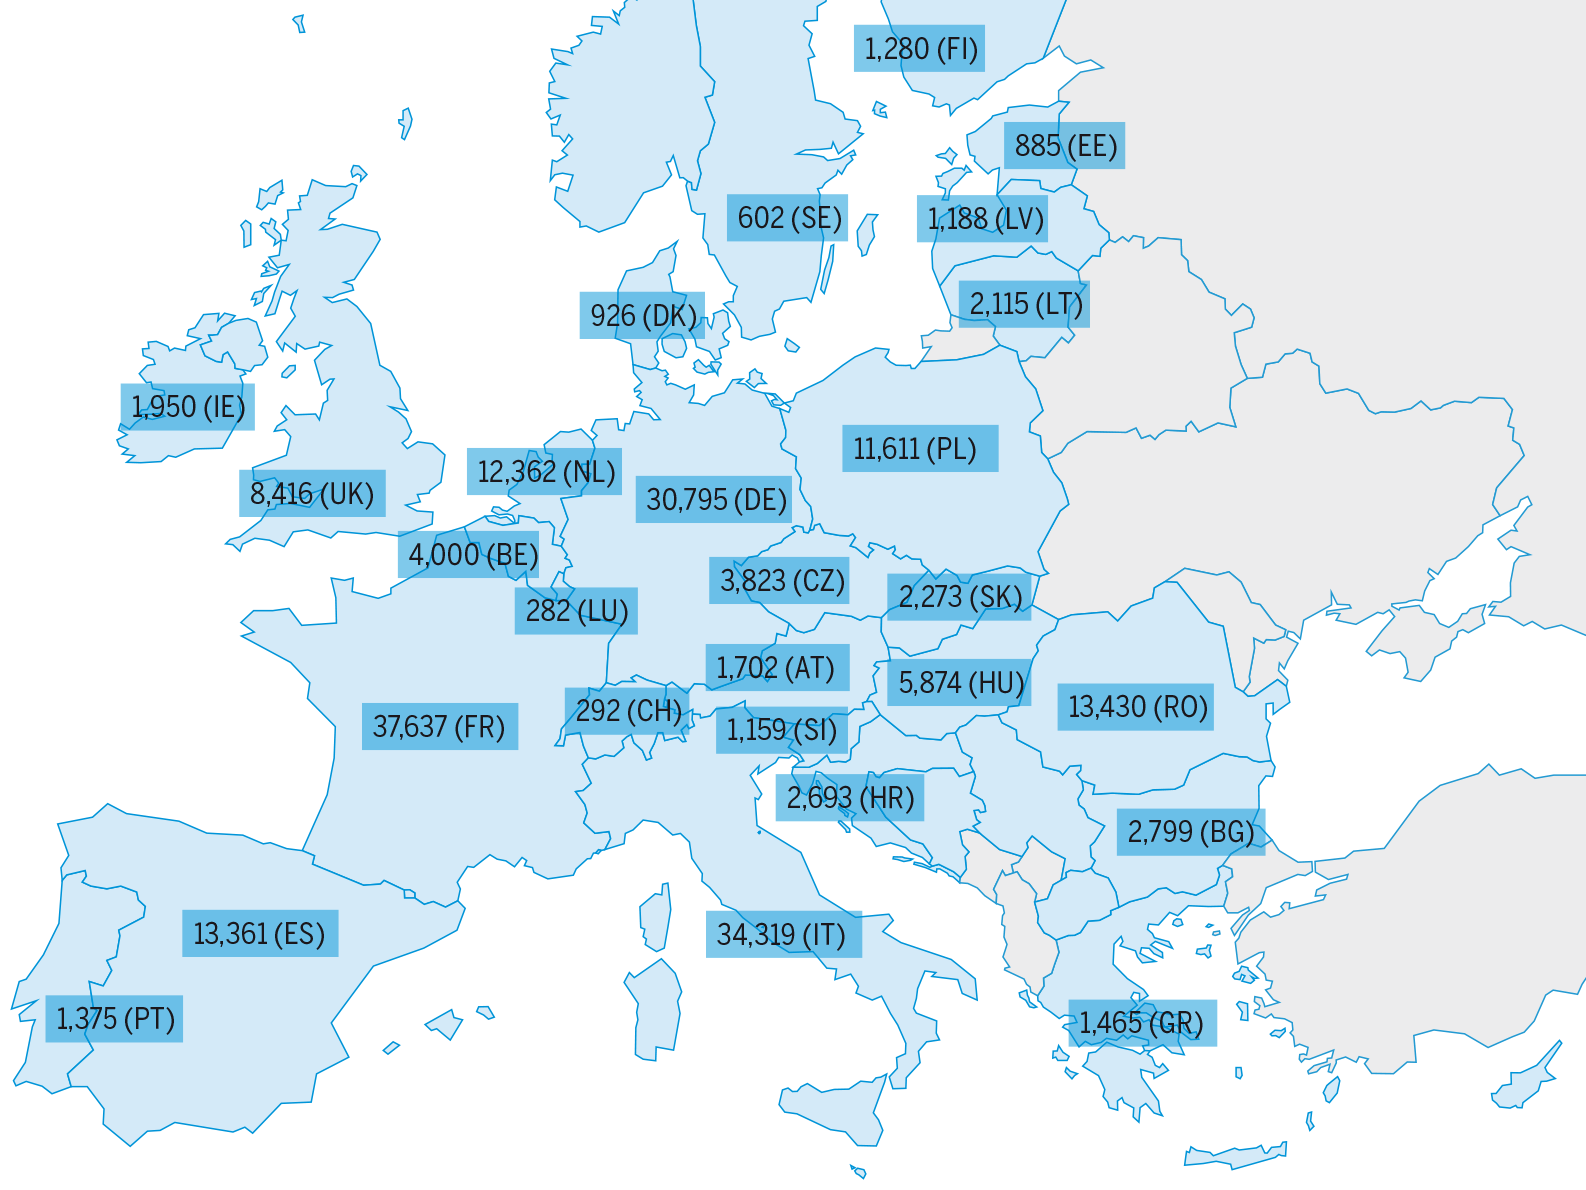
Today in EU and UK there exist around 198,500 km of transmission pipelines and 9,500 MW of compressor stations.
The data included in the map represent the total length of 46 TSOs transmission pipeline. The definition of transmission pipeline might differ country by country.
107 transmission and compressor stations projects have been submitted to TYNDP 2020. These projects can be summarised according to the following categories:
- 46 interconnection projects between two or more countries. In some cases, only one side of the interconnection has been submitted since the other part is already existing or the project consist in the creation of additional capacity at the same IP where an interconnection already exists;
- 21 projects related to the constructions of compressor or metering stations;
- 22 projects related to new import or production development;
- 5 projects concerning upgrade, modernisation or enhancement of the system;
- 7 reverse flow projects;
- 5 infrastructure projects supporting the switch from low-calorific gas to high-calorific gas in Germany, France, Netherlands and Belgium;
- 1 project concerning methanisation of new areas.
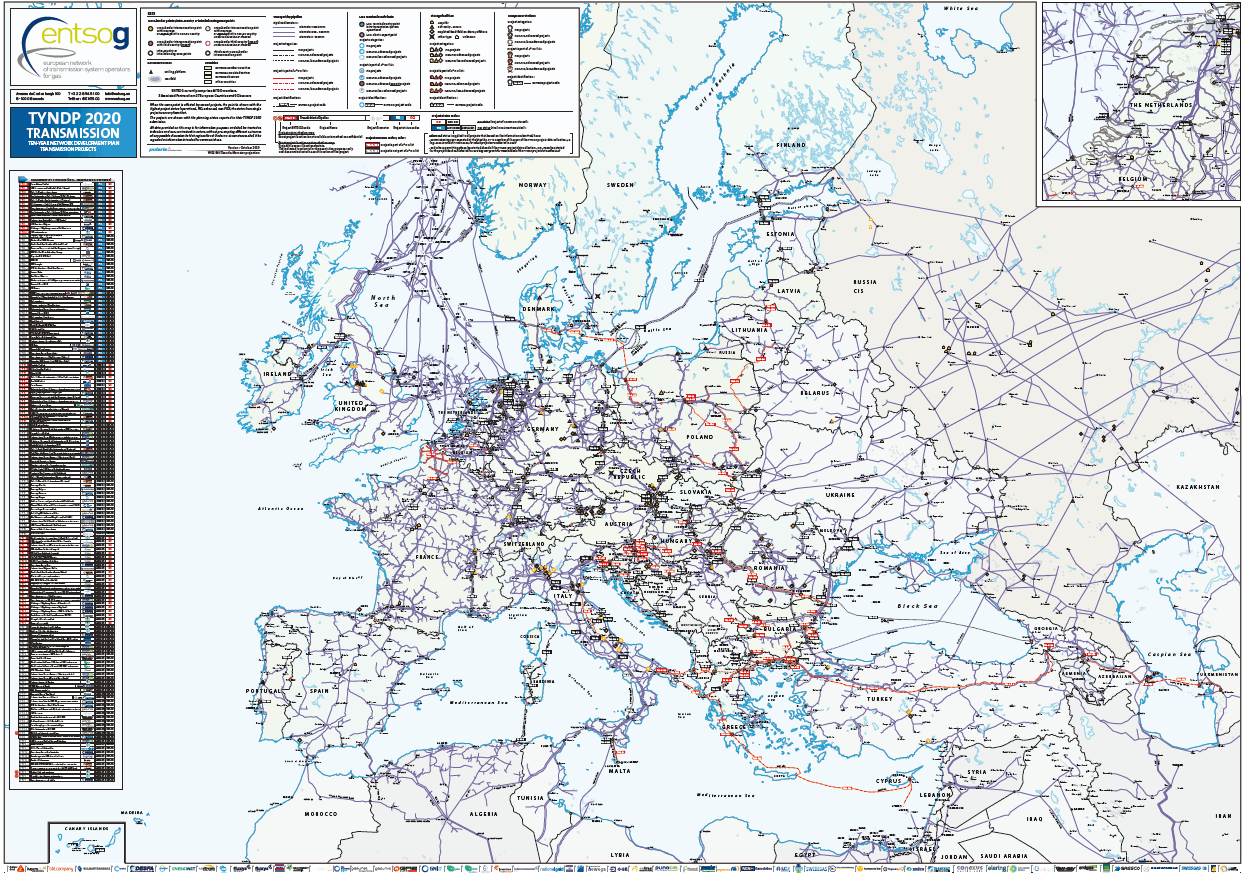
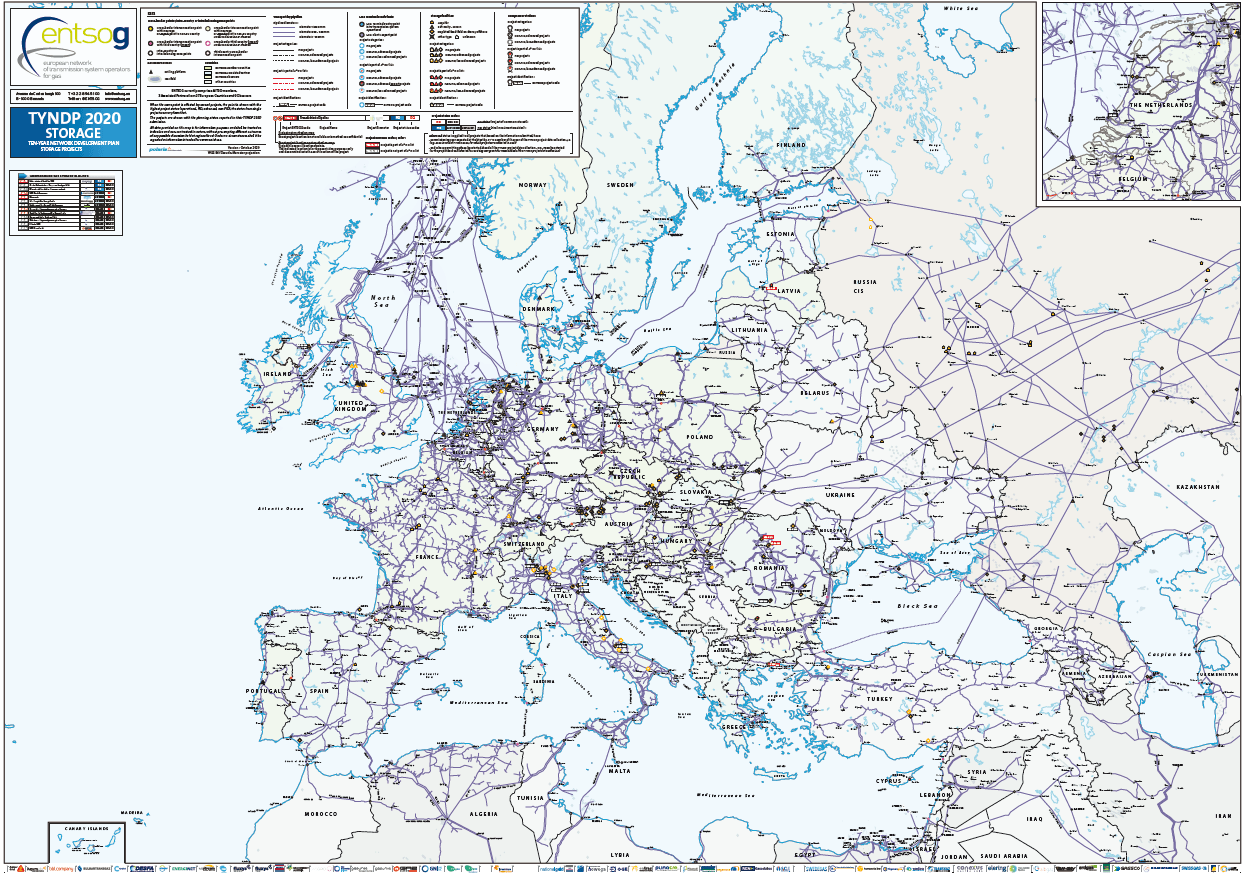
The following map shows the list of all projects concerning transmission and compressor (or metering) stations development. Evacuation pipelines to connect regasification terminals or storages are considered as part of sections 5.3.2 or 5.3.3
Map for transmission and compressor station projects in TYNDP 2020
Figure 5: Map for transmission and compressor station projects in TYNDP 2020
5.3.2 LNG projects
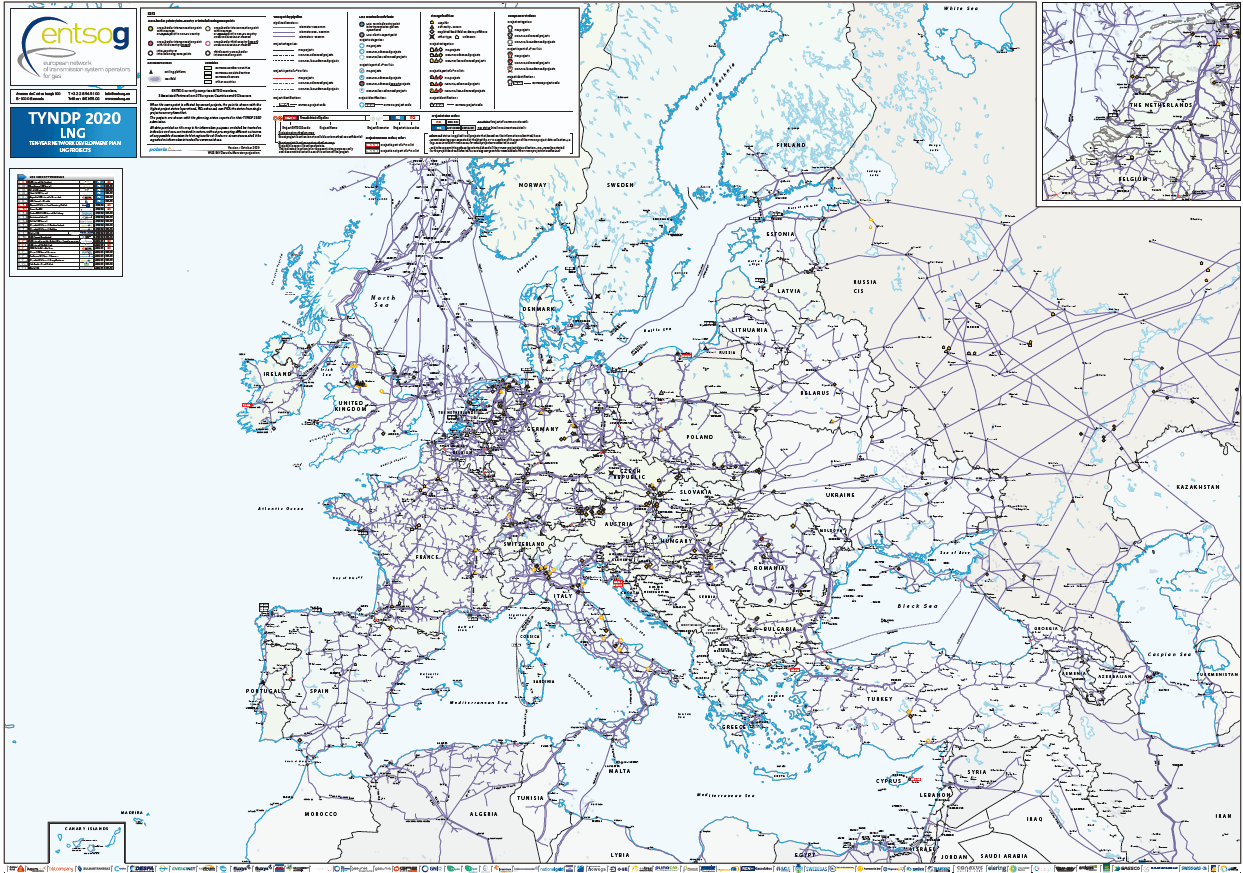
For TYNDP 2020 promoters submitted 22 projects related to LNG terminals. For 7 of these projects the respective evacuation pipeline projects connecting the terminal to the gas grid were submitted by different promoters. In one case (TRA-A-408) only the connecting pipe was submitted but not the LNG terminal.
Map for LNG reagsification terminals (including evacuation pipelines)
Figure 6: Map for LNG reagsification terminals (including evacuation pipelines)
5.3.3 UGS projects
For TYNDP 2020 promoters submitted 13 projects related to gas storage facilities (UGS)
Map for gas storage projects in TYNDP 2020
Figure 7: Map for gas storage projects in TYNDP 2020
5.3.4 ETR
ENTSOG TYNDP 2020 includes for the first time also Energy Transition projects.
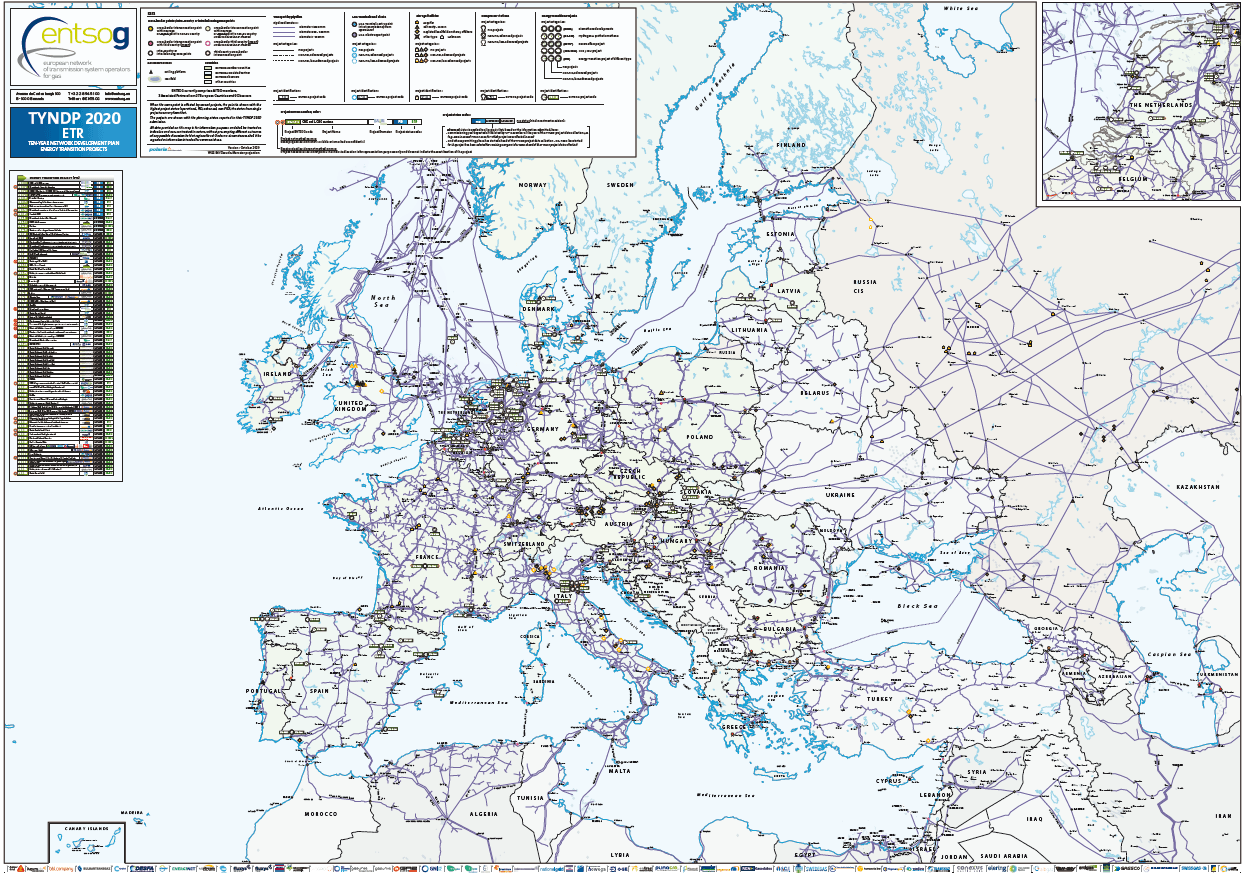
ETR projects are defined in the TYNDP 2020 Practical Implementation Document as follows: a project which facilitates the integration of renewables, the achievement of decarbonisation and efficiency targets, reduction of other air pollutants, sector coupling initiatives and, more generally, all projects specifically aimed at the energy system transformation for reaching sustainability goals and not already included in the previous project categories.
A total of 68 ETR aggregated projects (75 submissions) are included in TYNDP 2020:
- 44 Hydrogen and synthetic methane
- 7 Biomethane developments
- 6 CCS / CCU
- 5 CNG / LNG for transport (road, train, sea)
- 2 Reverse flow DSO-TSO
- 1 Hybrid compressor stations
- 1 Micro liquefaction
- 1 Smart multi energy system
- 1 Methane emissions reduction
Please read section 6 for more details on ETR projects.
Map for ETR projects in TYNDP 2020
Figure 8: Map for ETR projects in TYNDP 2020
5.4Further details on the TYNDP 2020 promoters’ submissions
This chapter provides more details on the investments submitted to TYNDP 2020.
In order to provide more detailed and transparent information, all the statistics described in the following sections consider:
- Individual investments submitted by different promoter not aggregated as described in section 5.3 but considered as many projects as promoters submitting the investment. To each of these investments an individual TYNDP code is in fact assigned. For example, for an interconnector between two countries here we will consider two separate investments. The same for LNG terminals (or UGS projects) and the evacuation pipeline(s) needed to connect the terminal (or the storage) to the gas grid;
- For projects developed in different phases, each phase as an individual investment and the whole project as multiple projects;
- As seen in section 5.3, some promoters have submitted individual facilities as separate investments (e. g. compressor station and pipe as individual project submissions) whereas others have joined together a number of investment in one project (e. g. compressor station and pipe under a single project submission).
Therefore, the high level of investments has to be understood in the light of the above considerations.
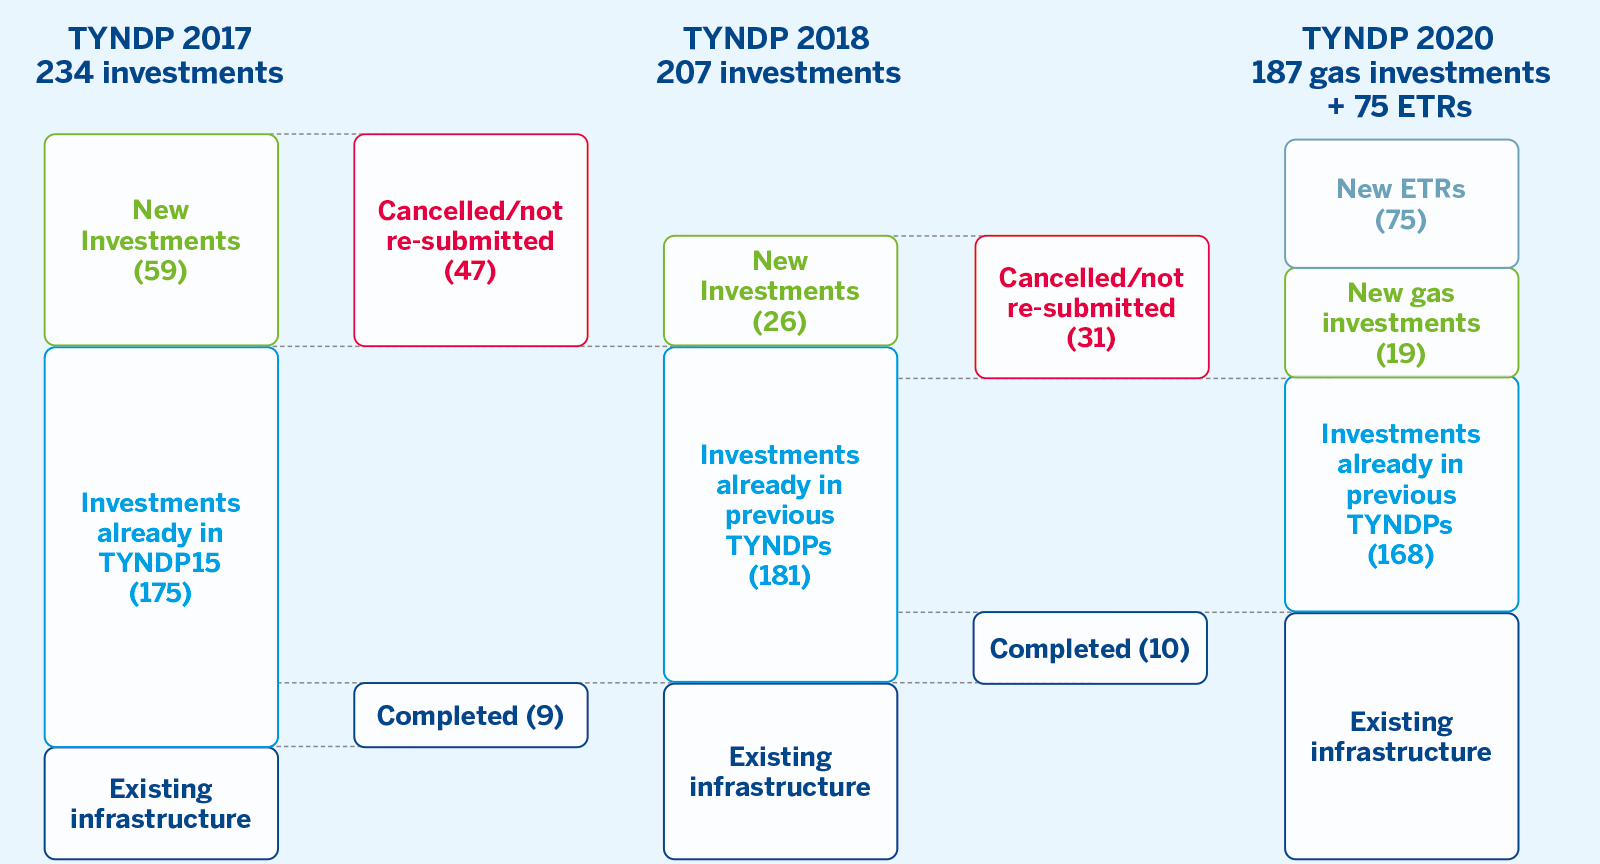
Overall 262 investments (of which 75 ETR projects) have been submitted to TYNDP 2020 by 91 different project promoters including both TSOs and third party promoters. Figure 9 provides the overview for this submission, compared to the previous TYNDP editions.
The following conclusions can be drawn from figure 9:
- Thanks to the completion of 10 investments since TYNDP 2018 and to the investments with commissioning years 2019/2020 the European infrastructure is reinforced;
- The number of gas investments excluding ETRs (i. e. transmission, LNG, UGS), submitted for TYNDP 2018 has been reduced for TYNDP 2020 due to investments that have been completed, canceled or not resubmitted;
- For the first time, a number of 75 Energy Transition investments have been included in the TYNDP 2020 edition, which makes a total of 262 submissions included in TYNDP;
- As further elaborated in the assessment chapters, the aggregated number of existing and planned infrastructures in TYNDP 2020 confirms that more infrastructure development is needed in some specific areas.
5.4.1 Overview per status
Considering all submitted investments but ETRs, when compared to the 207 submissions in TYNDP 2018 we observe a reduction to 187 in the 2020 edition. This reduction stems from:
- The requirement introduced by ENTSOG already in TYNDP 2017 that projects being part of the previous TYNDP need to be actively resubmitted in order to be considered in the current TYNDP;
- The application of the ENTSOG PID that sets clear administrative and technical criteria to be matched by promoters and projects in order to be considered eligible for inclusion in the TYNDP;
- Completed projects have in the meantime further contributed to the reduction of the infrastructure gaps.
The following figures and tables provide a statistical overview of promoters’ submissions (see TYNDP Annex A for further details) based on information such as the type of infrastructure or the FID/PCI status. Those reports reflect all the details entered as part of the data collection process by project promoters.
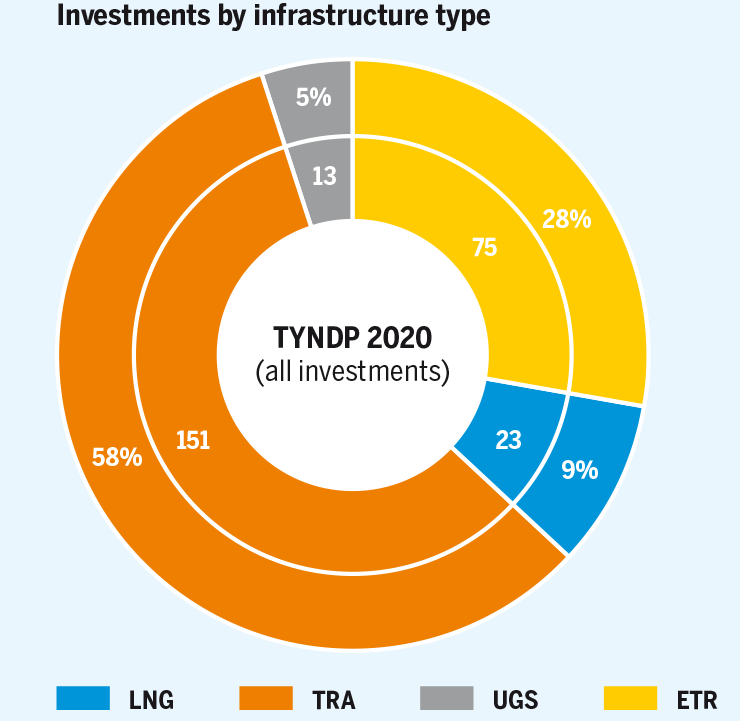
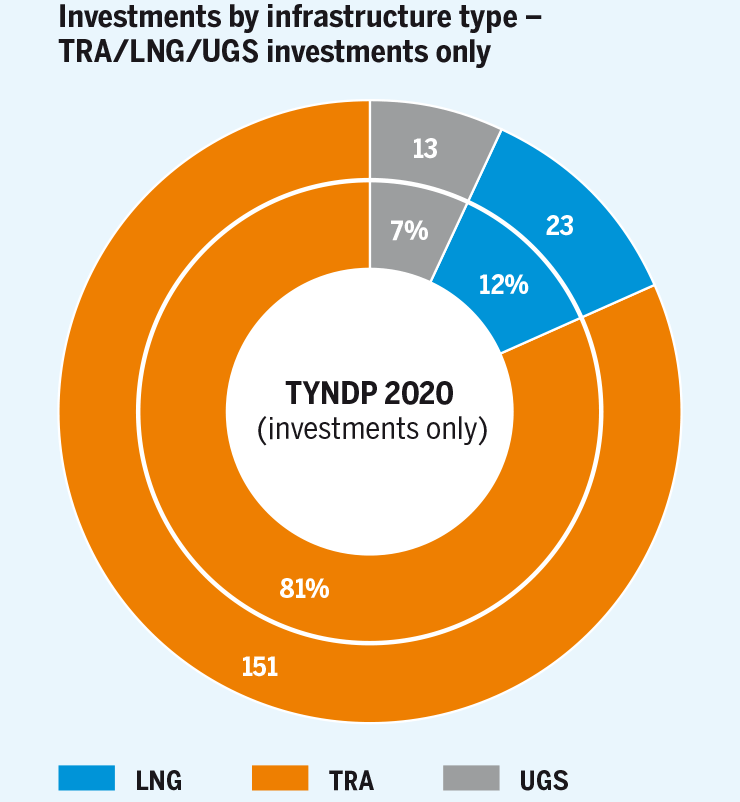
Figure 10 presents an overview of all the investments accepted for inclusion in TYNDP 2020 per type of infrastructure.
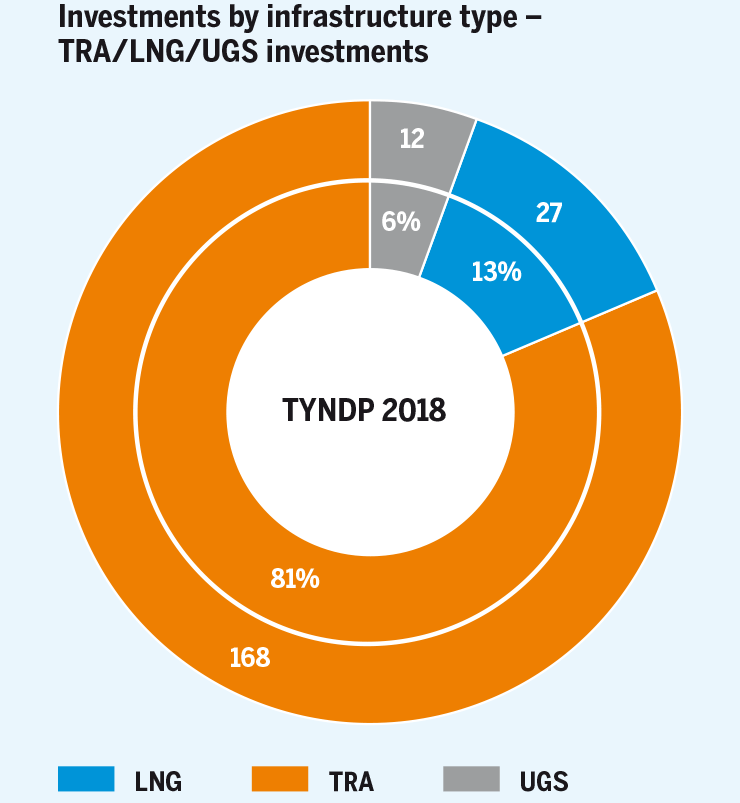
When comparing the investments inclusion in TYNDP 2018 and TYNDP 2020, figure 11 shows a general reduction in all type of projects.
Figure 11: Comparison of investments submission (excluding ETRs) in TYNDP 2020 and TYNDP 2018 per type of infrastructure. The inner circle represents the share of each project type; the outer circle represents absolute numbers.
Figure 12 shows the breakdown of TYNDP 2020 projects by infrastructure type and project status.
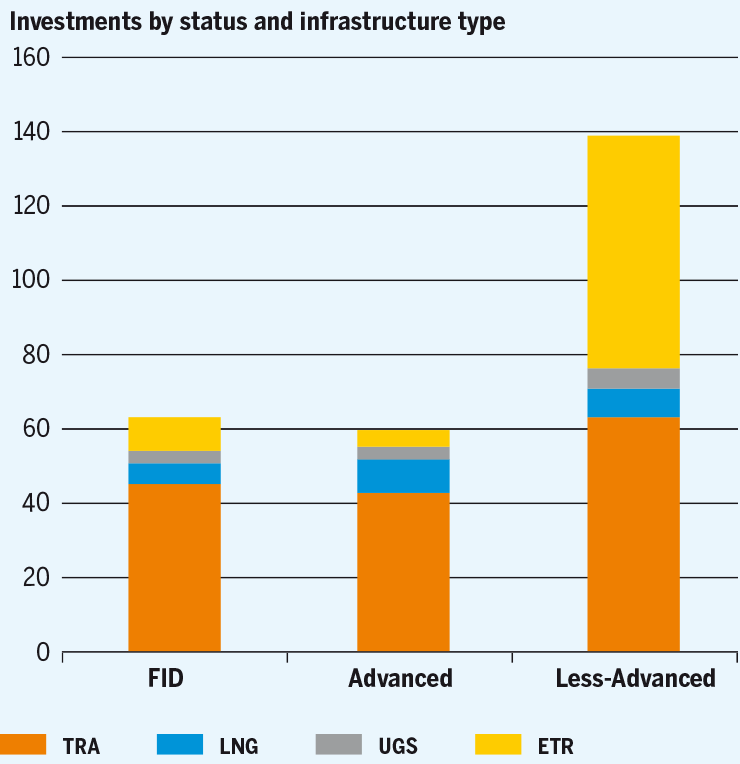
Figure 12: Breakdown of promoters’ submissions in TYNDP 2020 by infrastructure type and project status.
Thanks to the information collected, it has been possible to identify investments submitted for TYNDP 2020 that were not active anymore but for which promoters had missed to previously report the information to ENTSOG or that were deleted or not resubmitted.
| Total | TRA | LNG | UGS | ETR | |
|---|---|---|---|---|---|
| Completed | 10 | 8 | 1 | 1 | 0 |
| Still planned | 166 | 136 | 21 | 9 | 0 |
| Cancelled | 2 | 2 | 0 | 0 | 0 |
| Not resubmitted | 29 | 22 | 5 | 2 | 0 |
| New Projects | 94 | 13 | 2 | 4 | 75 |
Table 2: Number of investments from TYNDP 2018 completed, still planned, not-resubmitted and cancelled
The two cancelled projects are investments of REN Gasodutos having in TYNDP 2018 the Less-Advanced status and are related to the 3rd IP between Spain and Portugal.
Out of the 93 new submissions, 75 are ETR investments, 13 are related to transmission, 2 are LNG investments while 3 are UGS. With regards to the gas investments not including ETRs, the 18 new investments in TYNDP 2020 do not overall compensate the number of investments that were cancelled or not resubmitted (31 in total). Additionally, 10 investments were commissioned between TYNDP 2018 and TYNDP 2020.
Compared to the TYNDP 2018 submission:
- LNG-N-8151 was already in TYNDP 2018 but, together with the first phase of the project, as part of LNG-F-82. Consistently with the 4th PCI List, for TYNDP 2020 the project was submitted as two separate phases allowing for a more precise PS-CBA grouping and assessment. The first phase of the project is still associated to the TYNDP code LNG-F-82;
- TRA-N-11382 was already in TYNDP 2018 under the same TYNDP code that included two phases of the same project. Since TYNDP 2018 the first phase of the project (SCPX) has been completed therefore, the submission for TYNDP 2020 refers only to phase two of the project (SCPFX).
Regarding transmission investments, 8 have been completed since TYNDP 2018, while 24 investments have been cancelled or not resubmitted and 13 new TRA investments have been submitted.
Considering LNG projects, 1 LNG terminal related investment (Revithoussa 2nd upgrade) has been commissioned since TYNDP 2018 while 5 investments were not resubmitted. However, 2 new LNG investments were submitted for Croatia and Italy (respectively LNG-N-8153 and LNG-N-3044).
1 LNG terminal Krk 2nd phase, from LNG Croatia
2 South Caucasus Pipeline Future Expansion (SCPFX), from SOCAR Midstream Operations
3 LNG terminal Krk 2nd phase, from LNG Croatia
4 Italy-Sardinia Virtual Pipeline, from SNAM
Among the 12 UGS submissions to TYNDP 2018, one in Italy (UGS-F-10455) was completed. Moreover, 2 TYNDP 2018 investments have been not resubmitted while 4 new investments are planned, 3 in Romania (UGS-F-3116, UGS-N-3987 and UGS-N-3998) and 1 in Croatia (UGS-N-3479).
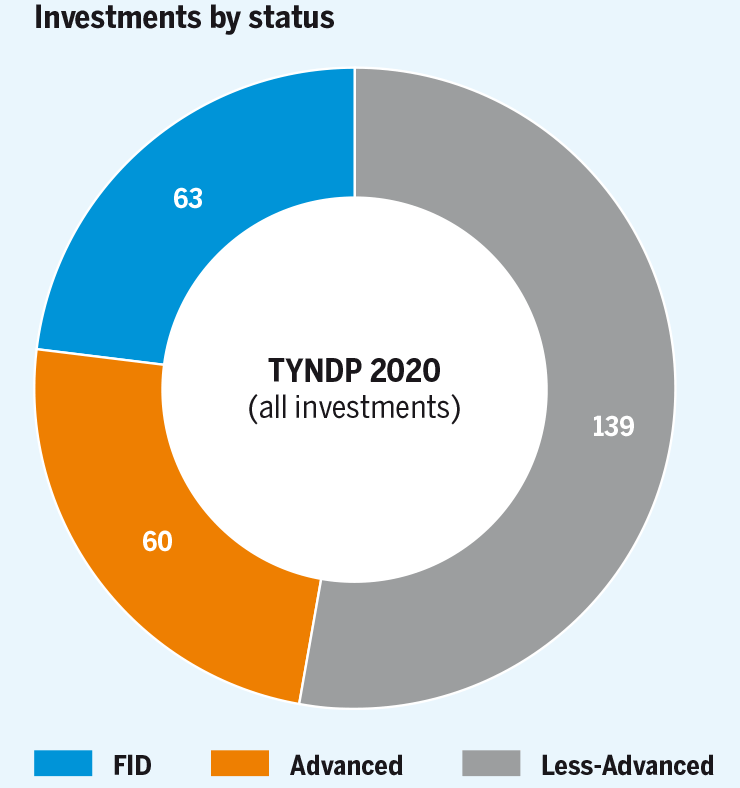
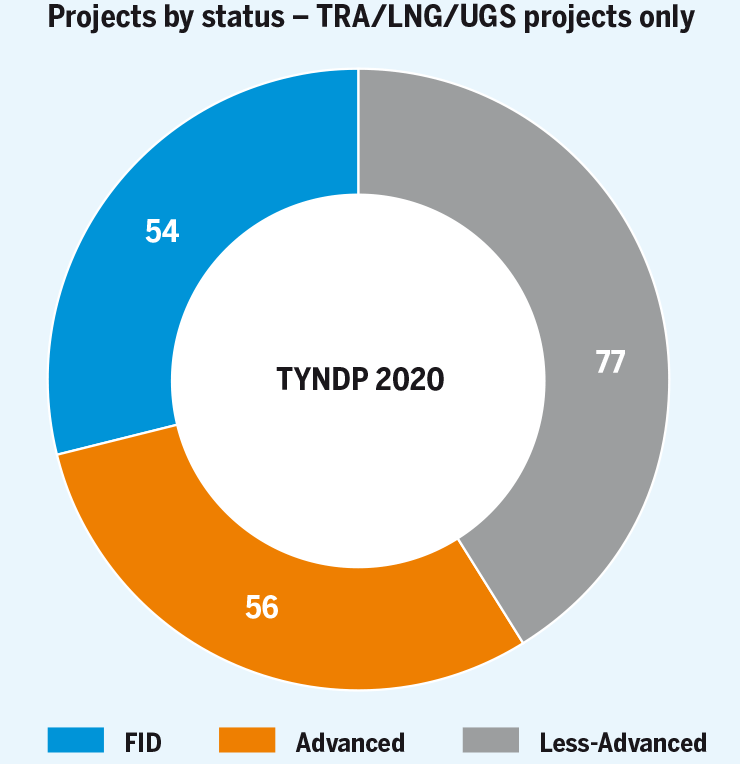
Figure 13 shows the total projects included in TYNDP 2020 based on their maturity status.
5 Bordolano second phase, from SNAM
6 Bilciuresti daily withdrawal capacity increase, from Depogaz
7 Ghercesti underground gas storage in Romania, from Depogaz
8 Falticeni UGS, from Depogaz
9 Gas storage facility Grubisno Polje, from Podzemno skladiste plina Ltd
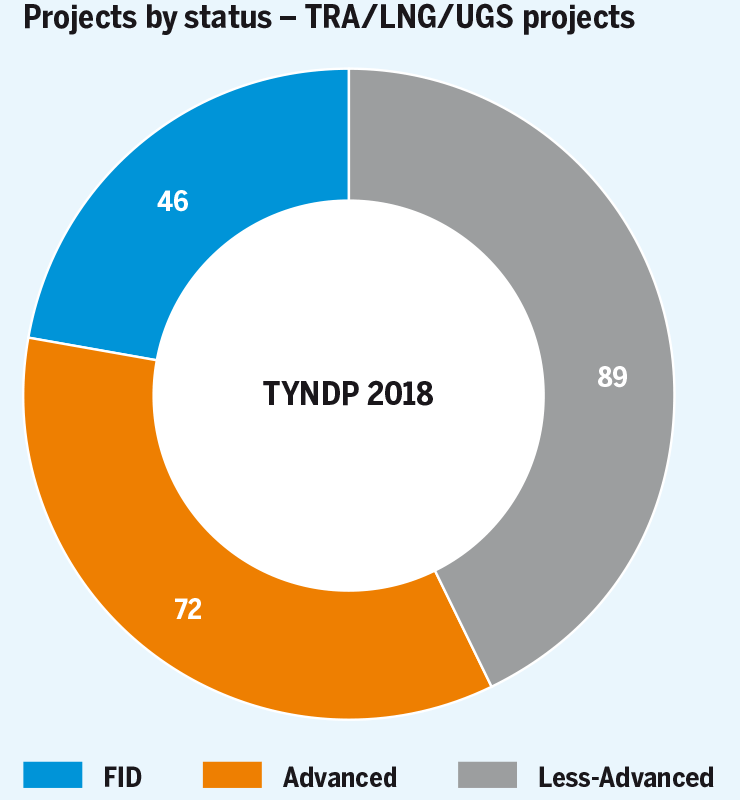
In order to be able to make a comparison at the maturity level between TYNDP 2018 and TYNDP 2020 submission, figure 14 shows for TYNDP 2020 the project status only for the gas projects which does not include ETRs i. e. transmission, LNG and UGS.
Figure 14: Comparison of submissions in TYNDP 2020 and TYNDP 2018 per FID status.
Compared to TYNDP 2018, an increase in the number of FID can be observed, especially among transmission, with 16 investments having taken the FID status between TYNDP 2018 and TYNDP 2020. Here below the list:
| Project code | Project name | Promoter | Country | Type | Maturity status 2018 | FID taken |
|---|---|---|---|---|---|---|
| TRA-F-964 | New NTS developments for taking over gas from the Black Sea shore | SNTGN Transgaz SA | RO | TRA | Advanced | 12.02.19 |
| TRA-F-755 | CS Rimpar | GRTgaz Deutschland | DE | TRA | Less-Advanced | 01.07.18 |
| LNG-F-824 | LNG Terminal in Klaipeda | Klaipedos Nafta | LT | LNG | Less-Advanced | 18.12.18 |
| TRA-F-1169 | Trans-Balkan Bi-directional Flow | LLC Gas TSO of Ukraine | UA | TRA | Less-Advanced | 23.09.19 |
| TRA-F-1254 | CS Elten | Thyssengas GmbH | DE | TRA | Less-Advanced | 01.03.16 |
| TRA-F-1276 | Compressor station at Nea Messimvria (3rd unit) | DESFA S.A. | GR | TRA | Less-Advanced | 28.06.19 |
| LNG-F-82 | LNG terminal Krk 1st phase | LNG Hrvatska | HR | LNG | Advanced | 31.01.19 |
| TRA-F-90 | LNG evacuation pipeline Omišalj – Zlobin (Croatia) | Plinacro Ltd | HR | TRA | Advanced | 11.06.19 |
| TRA-F-949 | Oude(NL)-Bunde(DE) GTG H-Gas | Gastransport Nord GmbH | DE | TRA | Less-Advanced | 09.04.18 |
| TRA-F-763 | EUGAL – Europaeische Gasanbindungsleitung (European Gaslink) | GASCADE Gastransport GmbH | DE | TRA | Advanced | 01.06.18 |
| TRA-F-814 | Upgrade for IP Deutschneudorf et al. for More Capacity | ONTRAS Gastransport GmbH | DE | TRA | Advanced | 31.12.18 |
| TRA-F-139 | Interconnection of the NTS with the DTS and reverse flow at Isaccea | SNTGN Transgaz SA | RO | TRA | Advanced | 25.04.18 |
| TRA-F-291 | NOWAL – Nord West Anbindungsleitung | GASCADE Gastransport GmbH | DE | TRA | Advanced | 01.05.19 |
| TRA-F-357 | NTS developments in North-East Romania | SNTGN Transgaz SA | RO | TRA | Advanced | 12.12.18 |
| UGS-F-374 | Enhancement of Incukalns UGS | Conexus Baltic Grid | LV | UGS | Advanced | 06.03.19 |
| TRA-F-500 | L/H Conversion Belgium | Fluxys Belgium | BE | TRA | Advanced | 28.12.18 |
| TRA-F-592 | Necessary expansion of the Bulgarian gas transmission system | Bulgartransgaz EAD | BG | TRA | Advanced | 31.01.19 |
| TRA-F-1267 | Upgrade Sülstorf station | GASCADE Gastransport GmbH | DE | TRA | Advanced | 01.03.19 |
| TRA-F-1277 | Upgrading GMS Isaccea 1 and GMS Negru Voda 1 | SNTGN Transgaz SA | RO | TRA | Advanced | 18.12.18 |
Table 3: TYNDP 2018 submissions having gotten FID status in TYNDP 2020
More in details, of the 54 FID initiatives in TYNDP 2020 (after excluding ETR FID projects):
- 31 were already FID in TYNDP 2018
- 13 with Advanced status in TYNDP 2018 took the FID
- 6 with Less-Advanced status in TYNDP 2018 took the FID
- 4 were not submitted for TYNDP 2018
Submissions having the Advanced and Less-Advanced status show a decrease mainly because some of them reached the FID status. A similar decrease can be also observed in case of Less-Advanced initiatives because many projects with this maturity status have not been resubmitted for TYNDP 2020.
5.4.2 Overview of promoters’ investments per geographical location
The following charts provide a summary of promoters’ submissions based on their geographical location, infrastructure type and maturity status.
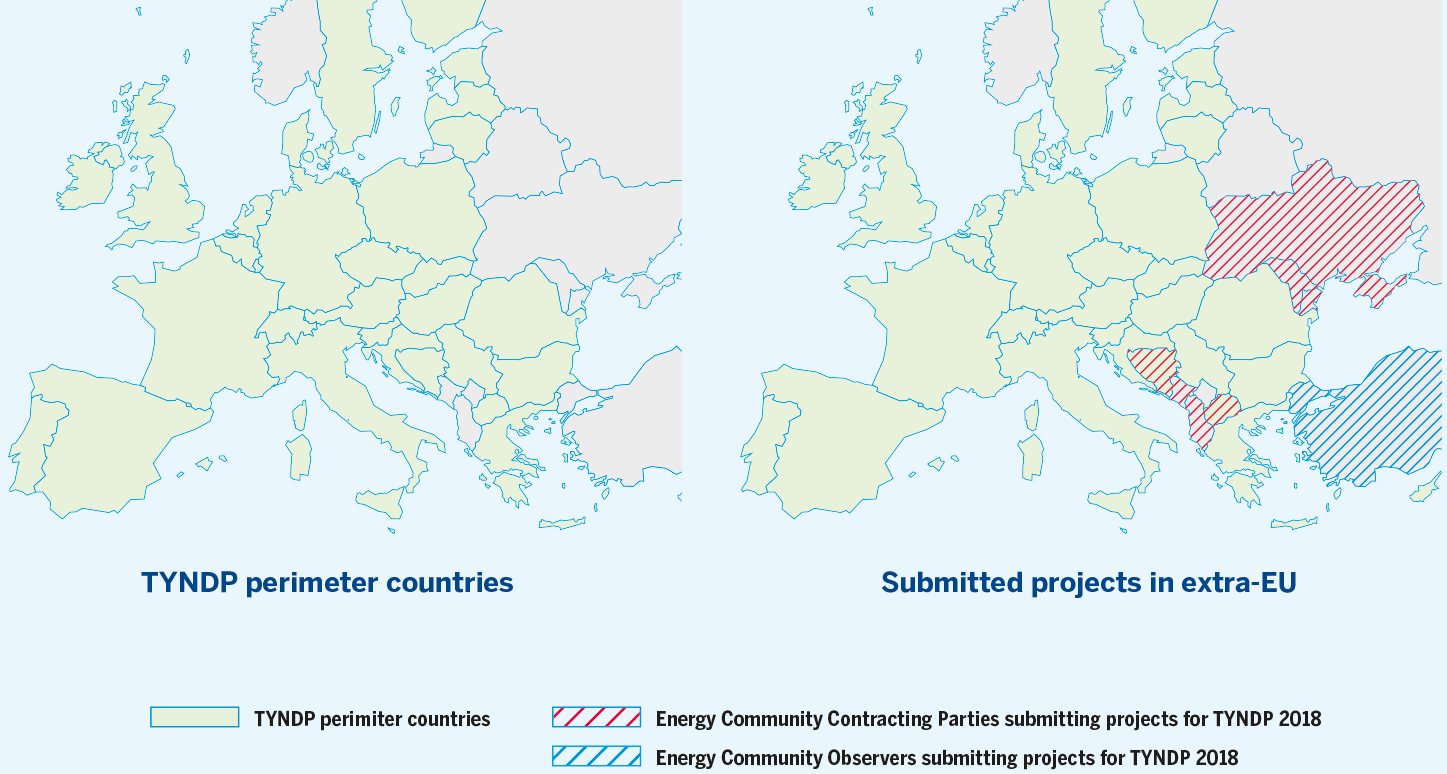
For this TYNDP edition, 262 initiatives were submitted concerning 35 countries, of which 10 countries10 not being part of the European Union.
Some of these countries are part of the Energy Community11 (as contracting parties or observers).
Non-EU projects can in fact be submitted to TYNDP in the below cases:
- Projects at least partially located in one of the TYNDP geographical perimeter countries;
- Supply chain projects bringing additional gas sources to EU border;
- Projects whose promoter is an ENTSOG Observer;
Non-EU investments can be subject to project-specific assessment in the below cases:
- The investment is fully located within the TYNDP perimeter (as defined in the ENTSOG Practical Implementation Document);
- The investment is an applicant to the upcoming PCI selection process and all the data required for the simulations are available to ENTSOG.
10 Albania, Azerbaijan, Bosnia Herzegovina, Georgia, Montenegro, North Macedonia, Turkey, Turkmenistan, United Kingdom and Ukraine.
11 The Energy Community is an international organisation which brings together the European Union and its neighbours to create an integrated pan-European energy market (https://www.energy-community.org/)
However, only 6 % of the total submissions actually refers to non-EU Member State.
Most of the submitted investments, including the ETRs, (247 in total) remain focused in the European Union countries and 36 % are planned in those countries that have joined most recently the European Union.12
In these countries the share of projects having reached the FID before the end of the TYNDP project collection is around 41 % (26 out of 63 investments).
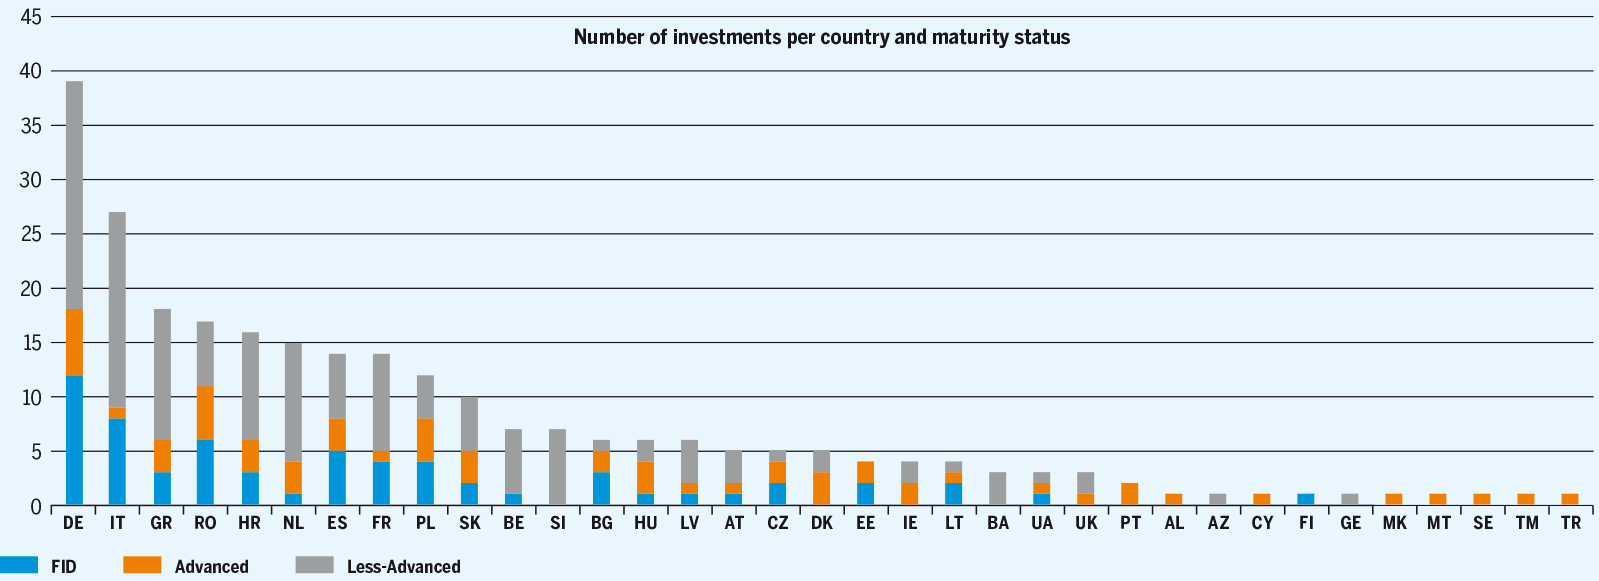
Still, more than 50 % of the submissions concern countries in Europe where the infrastructure is generally more developed, indicating that also in these countries there is still need for some further development. This is also confirmed by the fact that, in line with the rest of Europe, 24 % of the submitted initiatives in these countries (36 out of 152 investments) are well advanced, having already taken the FID and are planned to be commissioned in the upcoming years. It is still to be mentioned that for this part of Europe, 43 % of the submissions (65 out of 152 investments) are related to Energy Transitions projects, most of them having a less-advanced maturity due to relatively recent development of this type of projects.
12 The European Union (EU) was established on 1 November 1993 with 12 Member States, and 3 other countries (Austria, Finland and Sweden) joined it. From 1 May 2004 the EU was further enlarged with 11 more countries and from 1 January 2007 to Romania and Bulgaria (with Croatia joining EU from 1 July 2013).
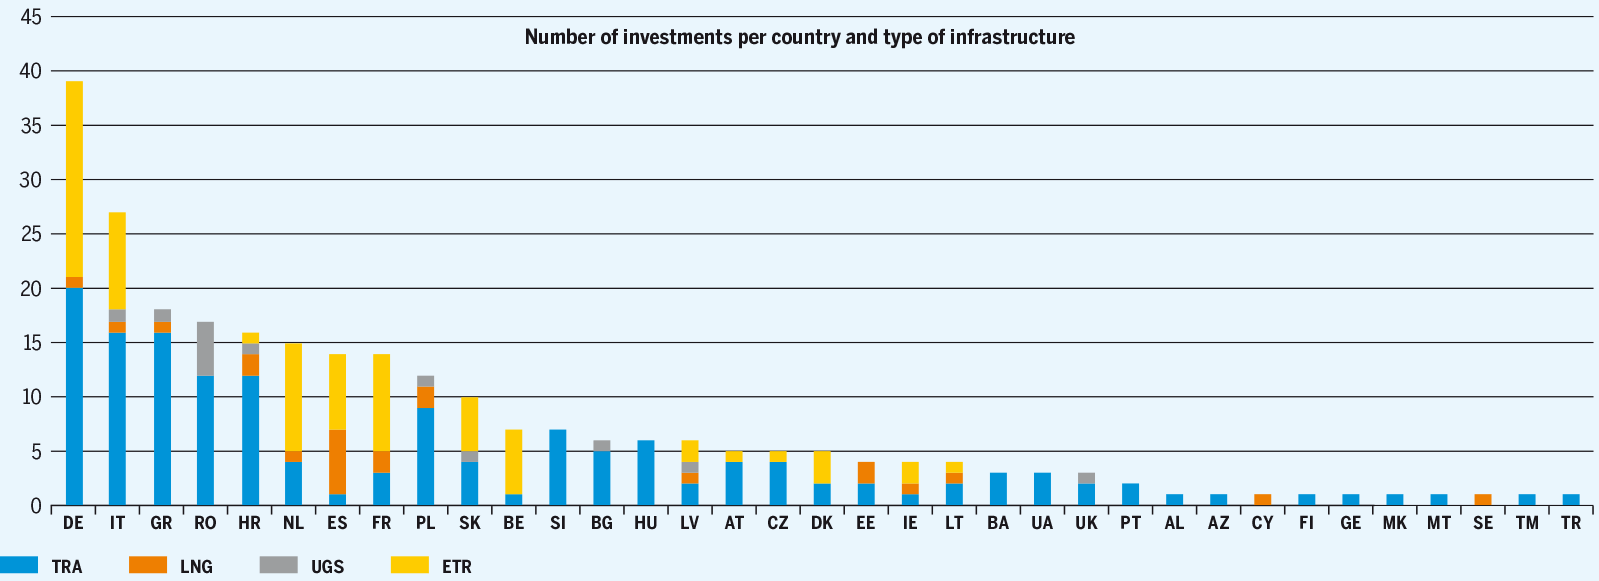
Figure 16: Number of investments per country and type of infrastructure
Figure 17: Number of investments per country and maturity status
The high number of submissions has to be understood also in the light of the fact that, in some countries, TSOs are required to ensure some consistency between projects included in the National Development Plans and projects included in the ENTSOG TYNDP.
In addition, in case of some countries, the relatively high number of projects includes also ETR projects. As such, Germany submitted 18 ETRs, Netherlands – 10, France – 9, Italy –9 and Spain – 7.
5.5Analysis of projects schedule
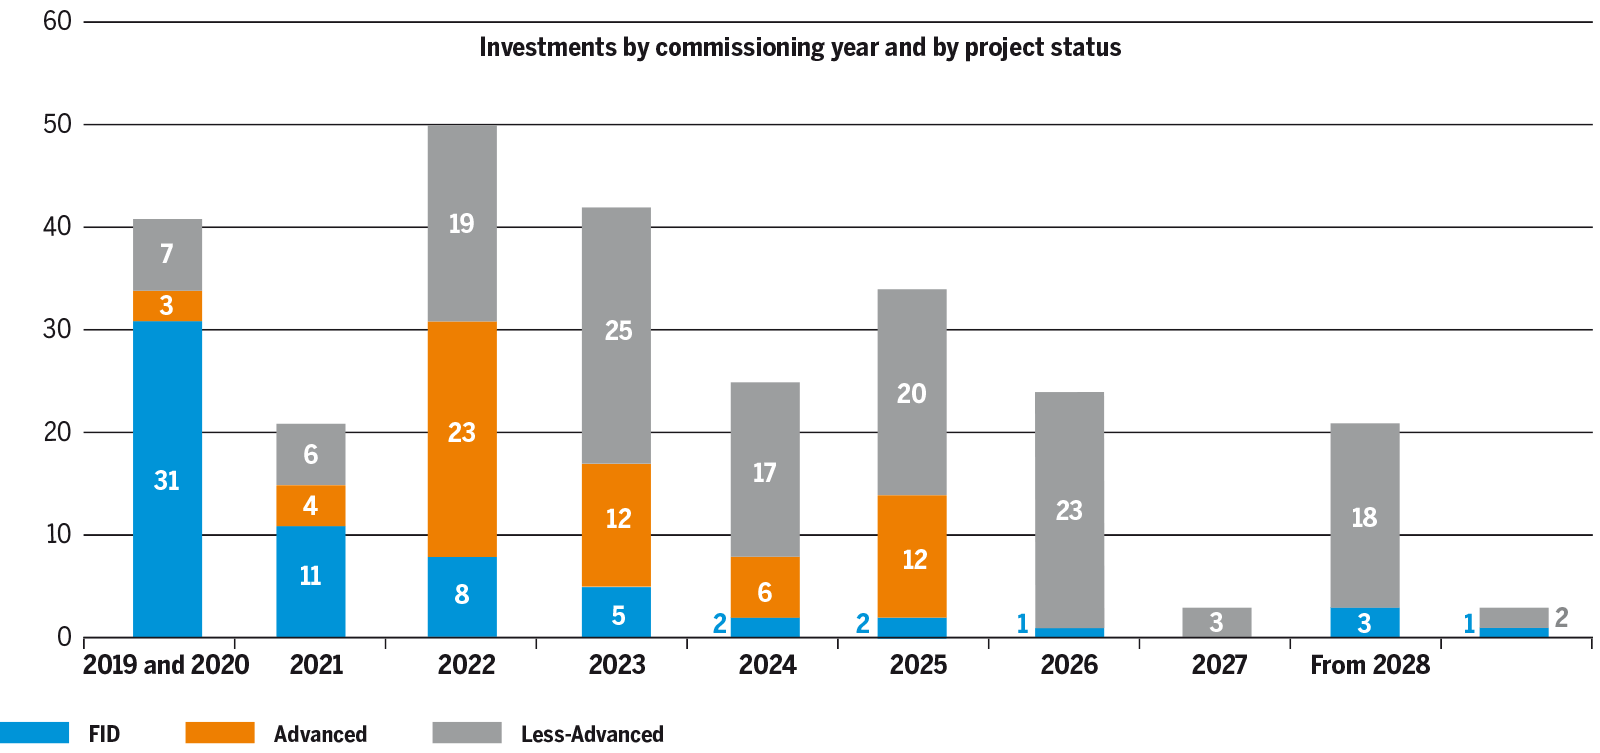
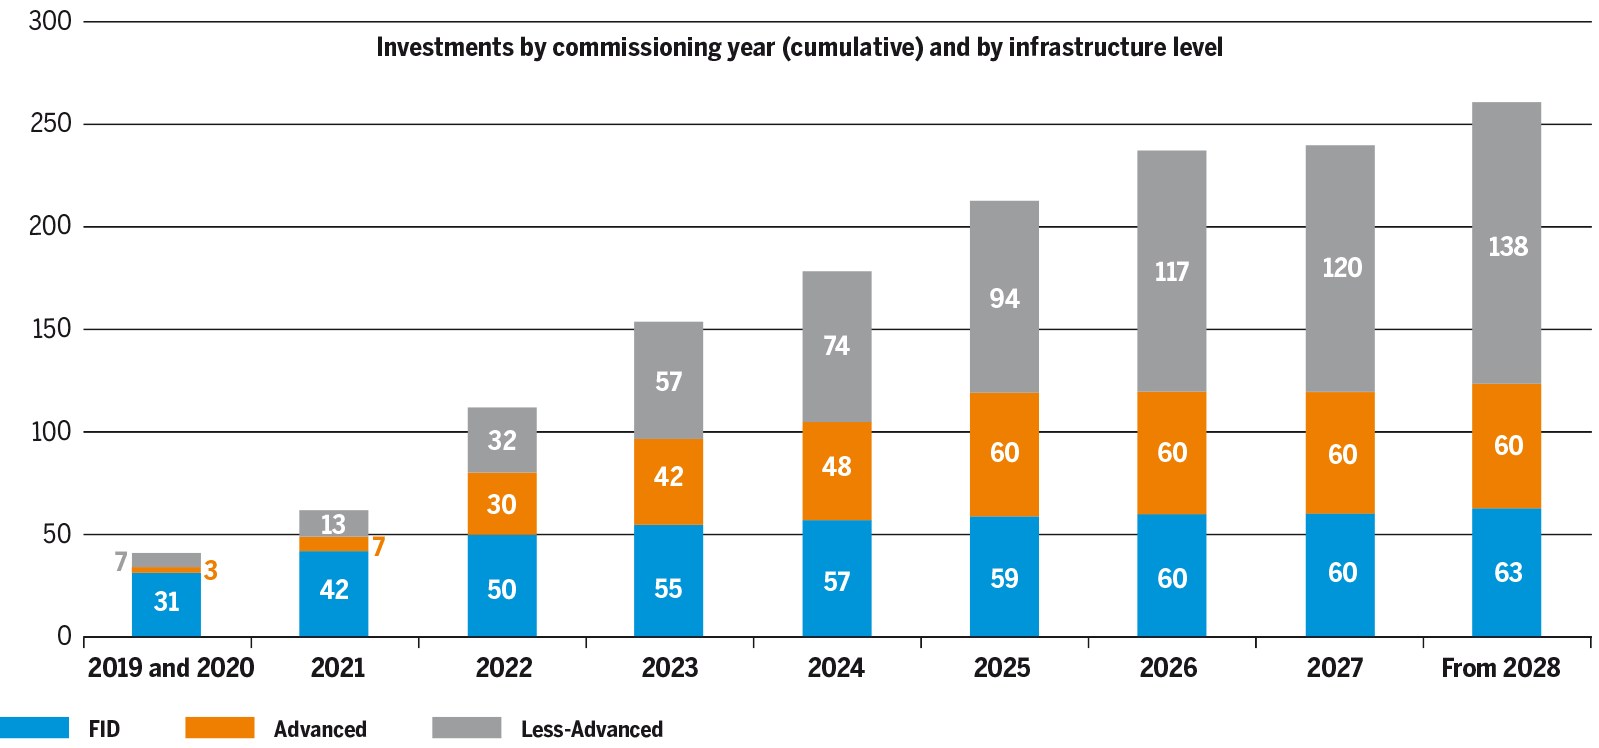
Figures 18 and 19 show the distribution of projects included in TYNDP according to the expected (first) commissioning year, also in an aggregated way.
Around 76 % of the submitted initiatives are expected to be commissioned not later than 2025 for a total of 199 investments out of the 262 submitted. Among these, 110 investments are well underway, presenting FID or Advanced status.
Most of the ones having FID or Advanced status are expected to be commissioned in the next 5 years.
Figure 18: Investments by commissioning year and by project status
Figure 19: Investments by commissioning year (cumulative) and by infrastructure level
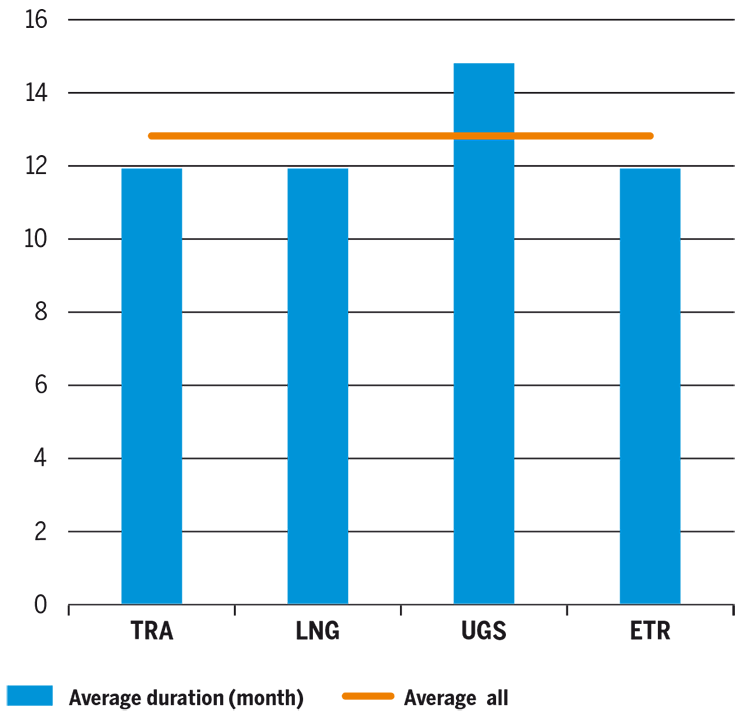
As part of the project collection, promoters have to provide information (except for some specific situations) about the projects’ schedules of the main project phases and milestones (Feasibility, FEED, Permitting, FID, Construction and Commissioning). ENTSOG has analysed these data with the purpose to have an overview on the average duration for each project phase and the average completion date for the main milestones.
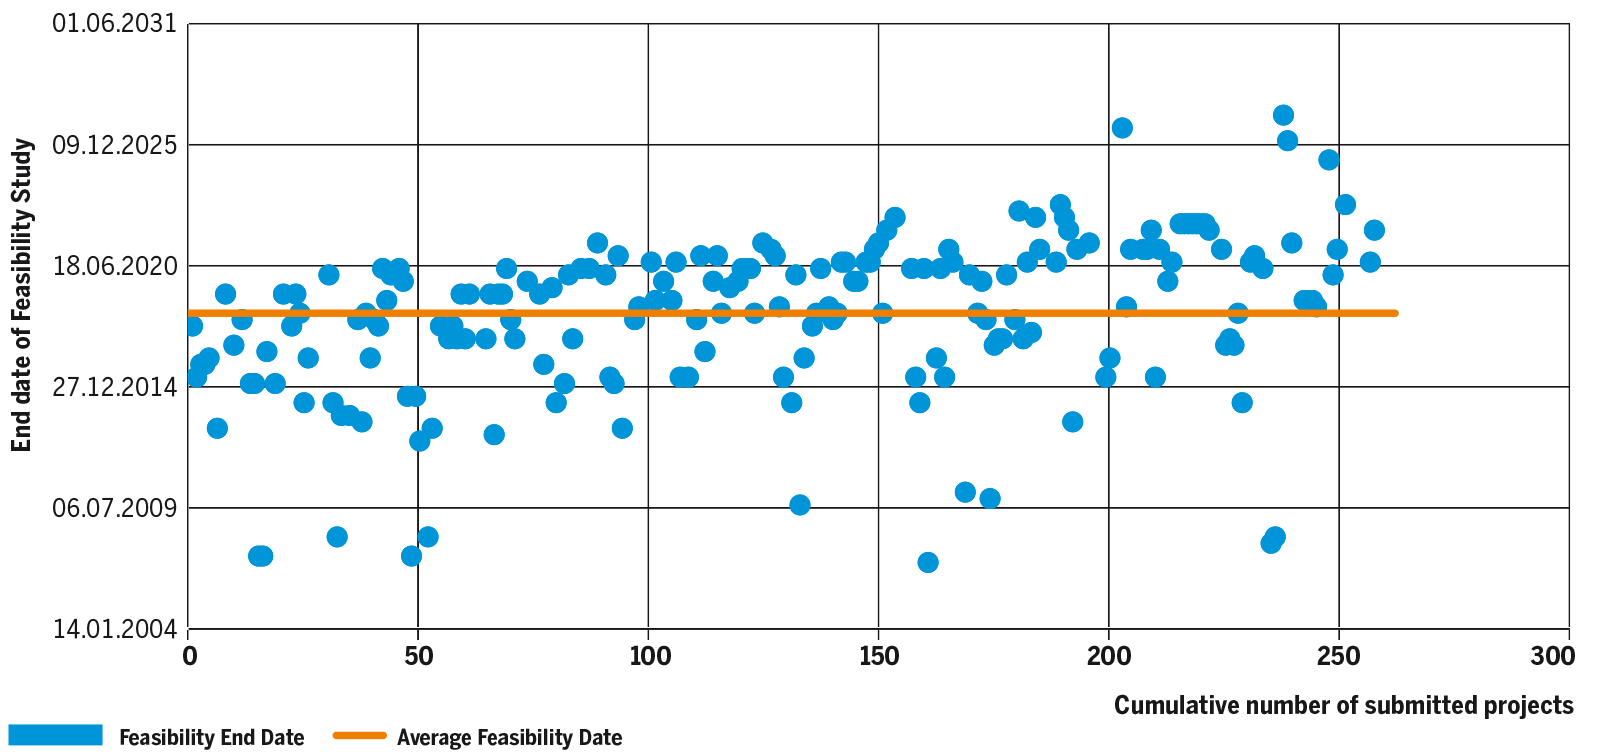
In case of the Feasibility Study phase, the start and end dates, either past or expected, have been provided for 199 investments. The average duration of the Feasibility Study phase for these projects is 13 months, between December 2016 and January 2018, with the highest average duration in case of UGS projects (15 months) while the other types of projects have the same average duration of 12 months).
Figure 21 shows the distribution of projects per end of Feasibility Study phase. The average Feasibility end date is 14/01/2018 and 86 investments have completed the Feasibility Study before this date while the remaining 113 investments for which data have been provided are expected to complete it after the average Feasibility end date.
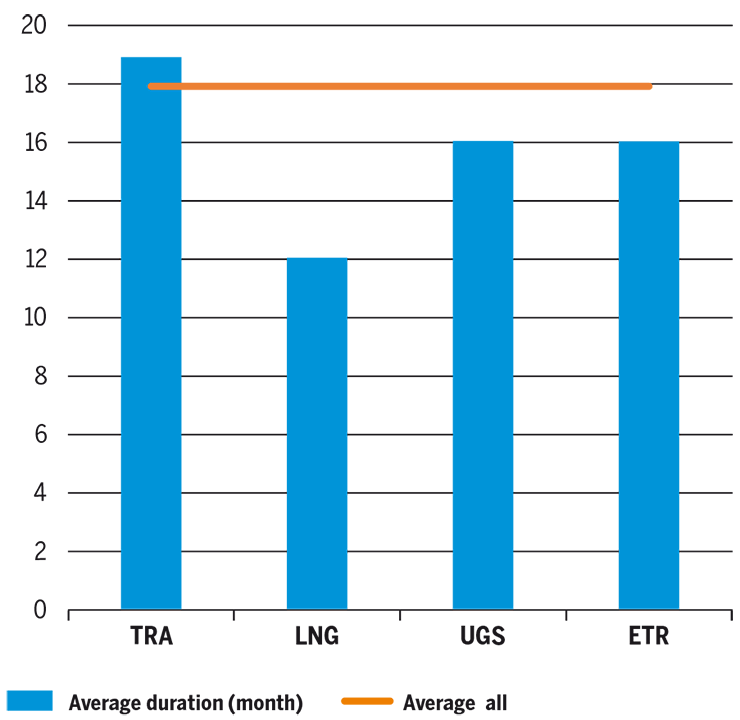
Regarding the FEED phase, the start and end dates, either past or expected, have been provided for 194 investments. The average duration of the FEED phase for these projects is 18 months, between November 2018 and May 2020, with the highest average duration in case of TRA projects (19 months) and the lowest average duration in case of LNG projects (12 months). UGS and ETR projects have an average duration of 16 months.
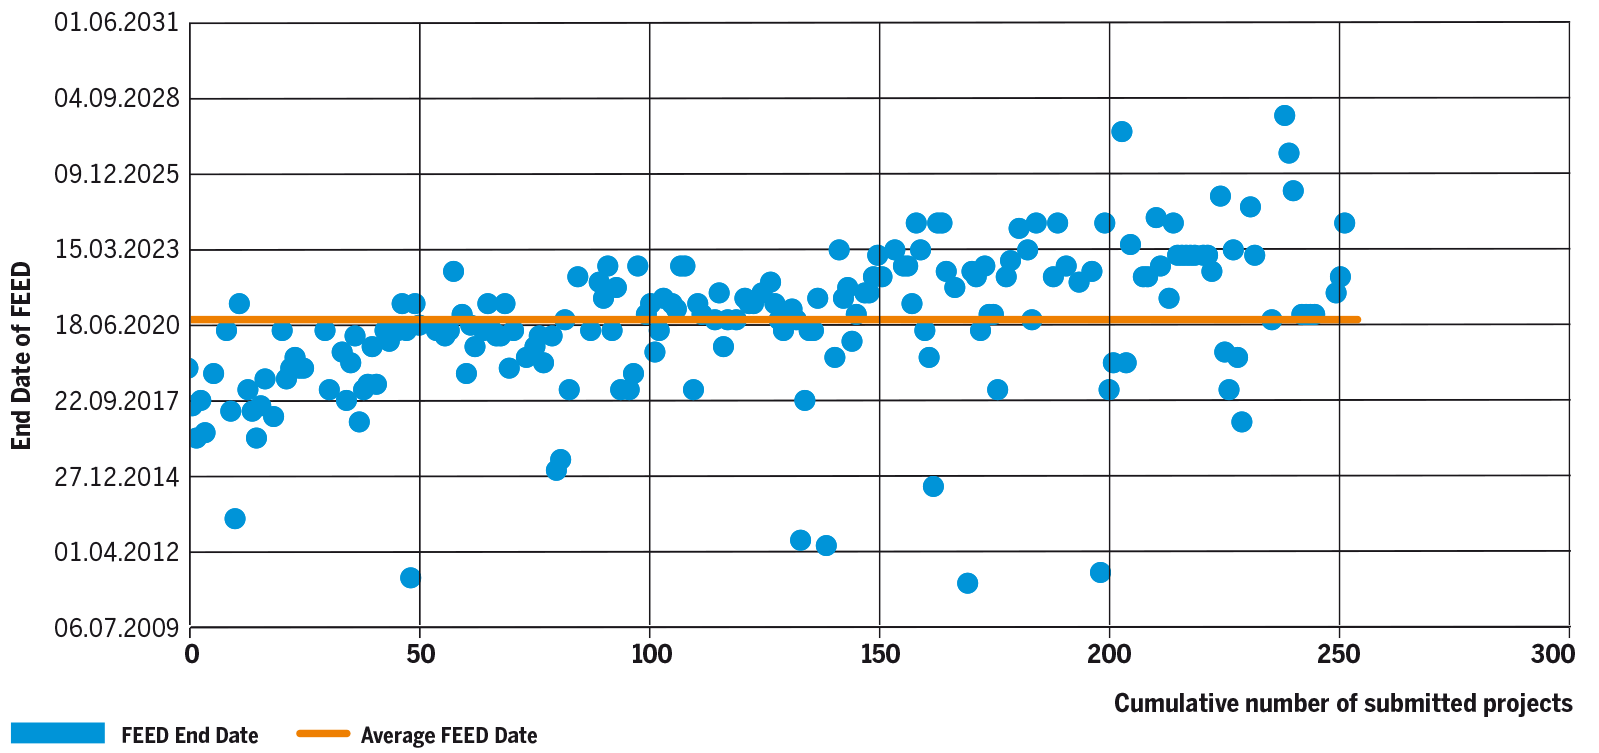
Figure 23 shows the distribution of projects per end of FEED phase. The average FEED end date is 19/05/2020 and 89 investments have completed the FEED before this date while the remaining 105 investments for which data have been provided are expected to complete it after the average FEED end date.
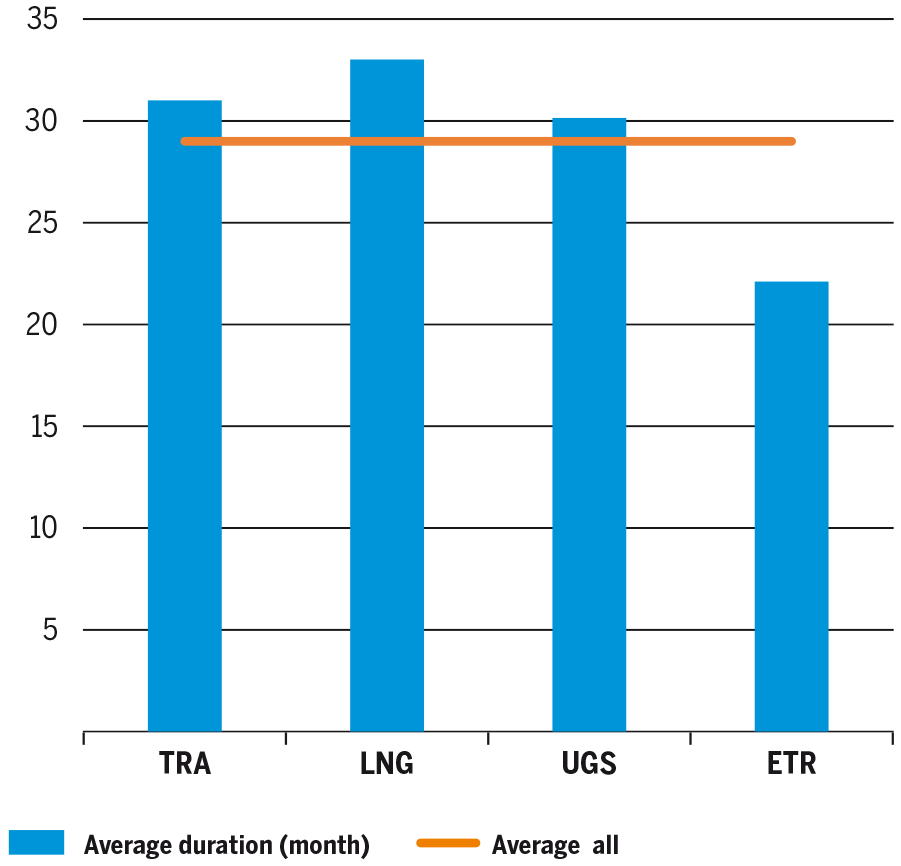
In case of the Permitting phase, the start and end dates, either past or expected, have been provided for 193 investments. The average duration of the Permitting phase for these projects is 29 months, between October 2018 and March 2021, with the highest average duration in case of LNG projects (33 months) and the lowest average duration in case of ETR projects (22 months). TRA and UGS projects have an average duration of 31, respectively 30 months.
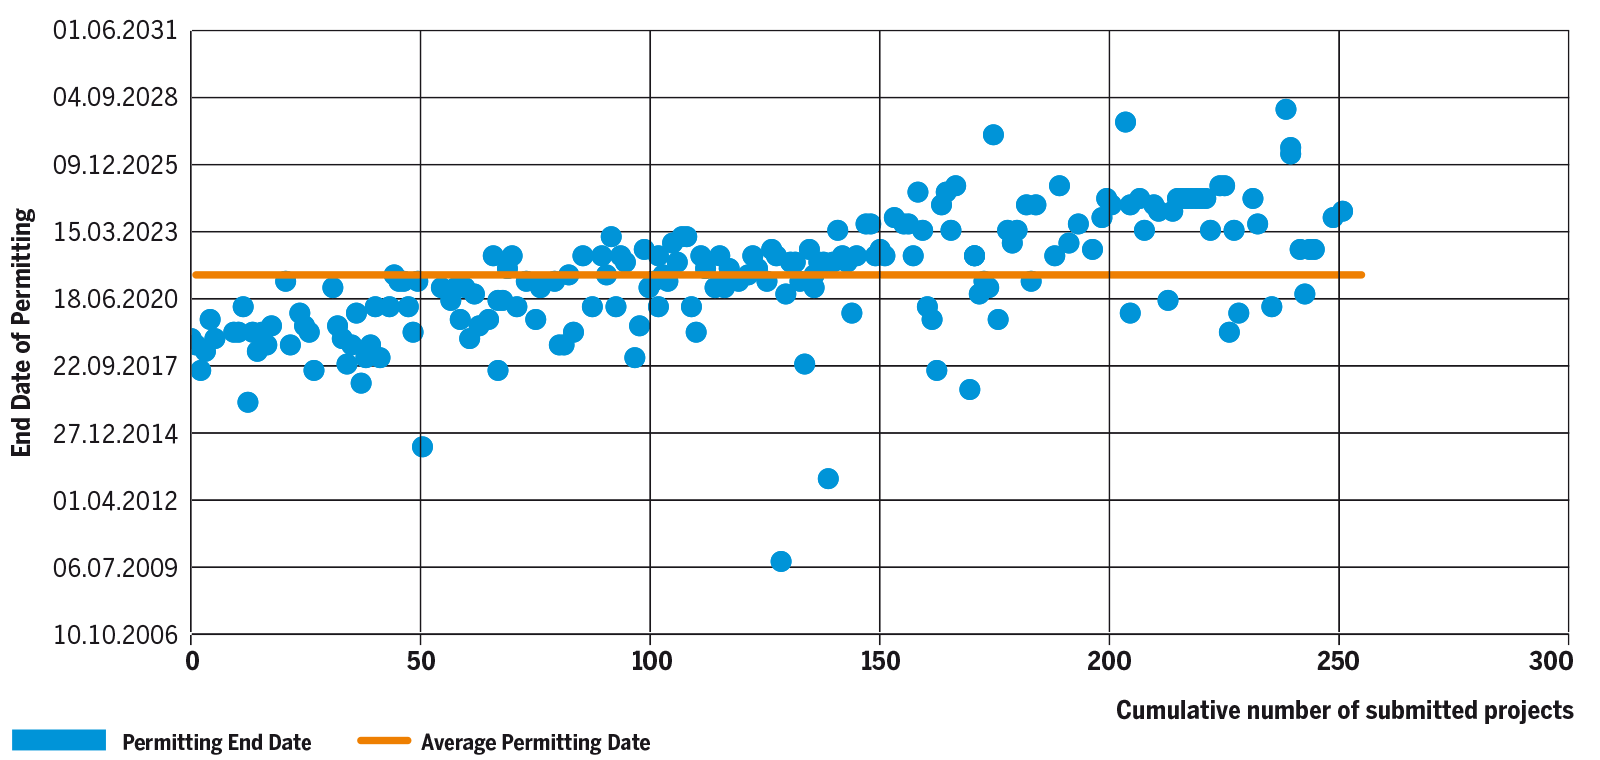
Figure 25 shows the distribution of projects per end of Permitting phase. The average Permitting end date is 20/03/2021 and 95 investments are supposed to complete the Permitting phase before this date while the remaining 98 investments for which data have been provided will complete it after the average Permitting end date.
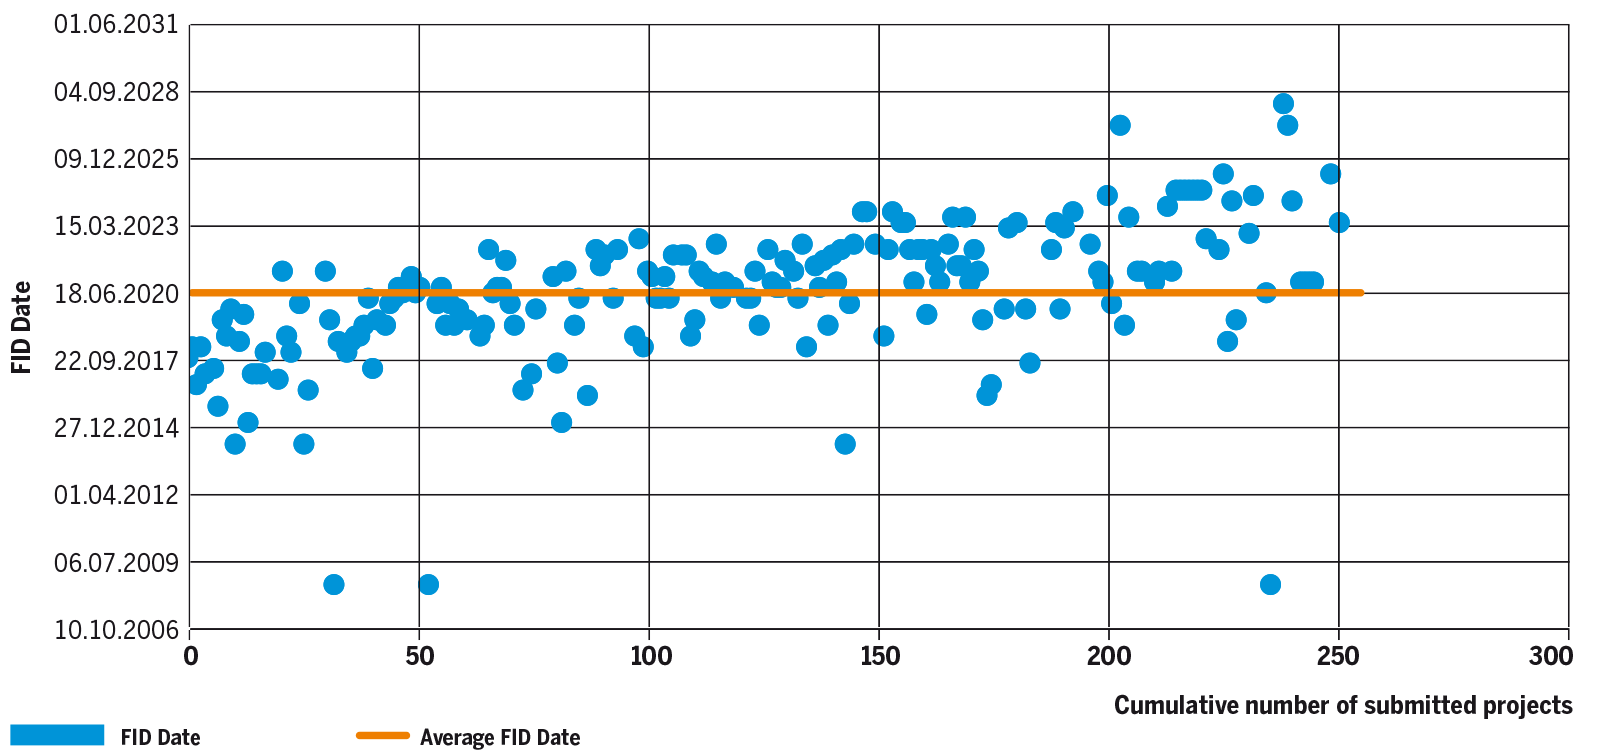
The FID date, either past or expected, has been provided for 198 investments. Figure 26 shows the distribution of projects per FID date. The average FID date is 26/03/2020 and 89 investments have completed the FID before this date while the remaining 109 investments for which data have been provided are expected to complete it after the average FID date.
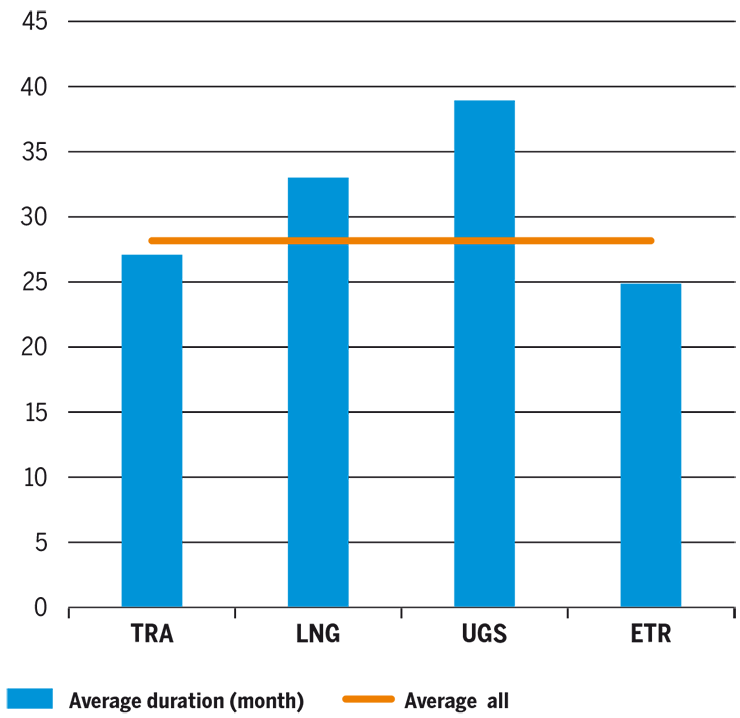
Regarding the Construction phase, the start and end dates, either past or expected, have been provided for 201 investments. The average duration of the Construction phase for these projects is 28 months, between June 2021 and October 2023, with the highest average duration in case of UGS projects (39 months) and the lowest average duration in case of ETR projects (25 months). TRA and LNG projects have an average duration of 27, respectively 33 months.
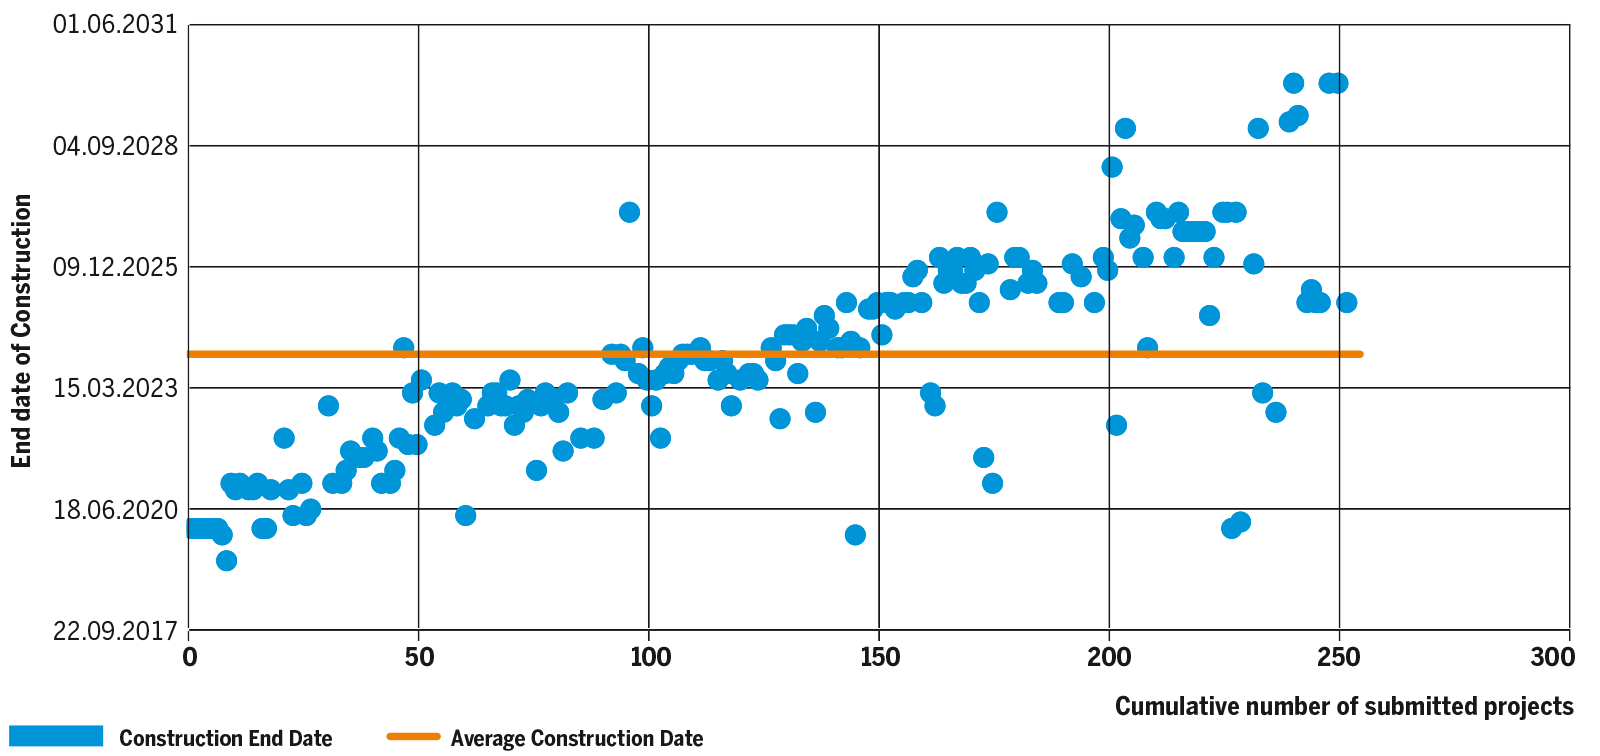
Figure 28 shows the distribution of projects per end of Construction phase. The average Construction end date is 17/10/2023 and 105 investments are supposed to complete the Construction phase phase before this date while the remaining 96 investments for which data have been provided will complete it after the average Construction end date.
The Commissioning date, either past or expected, has been provided for 261 investments out of 262 included in TYNDP 2020. The average Commissioning year for these projects is 2024 with 156 investments expected to be commissioned by the end of 2024 while the remaining 105 will be commissioned after 2024.
ENTSOG has analysed the advancement of submitted investments between TYNDP 2018 and TYNDP 2020.
| Completed in T2020 | FID | Advanced | Less-Advanced | Cancelled / Not- resubmitted | Total | |
|---|---|---|---|---|---|---|
| FID (T2018) | 11 | 31 | 2 | 2 | 46 | |
| Advanced (T2018) | 13 | 37 | 12 | 10 | 72 | |
| Less-Advanced (T2018) | 6 | 16 | 49 | 18 | 89 | |
| Total | 11 | 50 | 53 | 63 | 30 | 207 |
Table 4: Evolution of projects from TYNDP 2018 to TYNDP 2020
Of the 46 investments already having the FID status in TYNDP 2018:
- 11 were completed
- 31 are still planned with FID status in TYNDP 2020
- 2 are still planned but no more FID:
- TRA-N-13713 and TRA-N-113814 present in TYNDP 2020 have a Less-Advanced status while in TYNDP 2018 they both had FID status. In case of project TRA-N-137, the promoter has changed since TYNDP 2018 from Ministry of Energy in Bulgaria to Bulgartransgaz. The new promoter states that FID depends on finalising the transfer of the project to Bulgartransgaz and the timeline for the implementation of the preparatory activities. As for TRA-N-1138, project South Caucasus Pipeline – (Future) Expansion –SCP-(F)X included two phases of the same project while the FID was assigned to first phase (SCPX) which was completed in the meanwhile. Therefore, the submission for TYNDP 2020 refers only to the second part of the project (SCPFX) which has not yet taken FID and is Less-Advanced.
- 2 projects have not been resubmitted (TRA-F-102815 and UGS-F-24216).
Of the 72 investments having the Advanced status in TYNDP 2018:
- 13 got the FID after TYNDP 2018 project collection;
- 37 still have the Advanced status;
- 12 moved from Advanced to Less-Advanced mainly because the projects have been delayed or rescheduled (TRA-N-86, TRA-N-75, TRA-N-1058, TRA-N-66, TRA-N-809, LNG-N-62, TRA-N-63, TRA-N-325, LNG-N-297, TRA-N-361, TRA-N-423 and TRA-N-1057)
- 10 were not resubmitted (TRA-N-161, TRA-N-252, TRA-N-256, TRA-N-727, LNG-N-198, TRA-N-593, TRA-N-594, TRA-N-974, TRA-N-975 and UGS-N-1229)
Of the 89 TYNDP 2018 investments having Less-Advanced status:
- 6 got the FID after TYNDP 2018 project collection;
- 16 moved from Less-Advanced to Advanced status;
- 49 are still planned and present Less-Advanced status;
- 18 were cancelled/not-resubmitted.
13 Interconnection Bulgaria – Serbia, from Bulgartransgaz
14 South Caucasus Pipeline Future Expansion (SCPFX), from SOCAR
15 Albania – Kosovo Gas Pipeline from Ministries in Albania
16 Cornegliano UGS from ITAL Gas Storage
For initiatives having already reached the FID before their submission to TYNDP 2020 (63 projects) the analysis of project submissions shows:
- 29 initiatives whose construction phase is expected to end within 3 years from when the FID was taken;
- 21 initiatives whose construction phase is expected to end within 4 to 7 years from when the FID was taken;
- 2 initiatives whose construction phase is expected to end after more than 7 years from when the FID was taken;
- 11 initiatives did not indicate the expected end of the construction phase.
Most of the FID projects are expected to be completed within 5 years from when the construction works will start.
The way FID is taken by each promoter may differ. Some may take FID after the granting of permits and some before initiating the permitting procedure. Those permitting procedures often make out the longest phase of the whole project schedule which often lasts more than 5 years. Therefore, the above analysis is not necessarily indicative of the project lead time for any future projects as there are, among the projects, some small and some very complex ones.
For investments not having gotten the FID yet but presenting an Advanced status (60 projects) the analysis shows:
- 43 investments for which promoters were able to provide the relevant information are expected to be commissioned within 5 years from when the FID is expected to be taken while other 8 submissions between 6 and 10 years;
- An average of almost 4 years between the year when the construction works are expected to start and when the project is expected to be commissioned.
Finally, with regards to investments presenting a Less-Advanced status, information may not be always fully available making it de facto impossible to build any statistics. In this case, for example, most of the project promoters were not able to provide indication of the expected date when the FID will be taken.
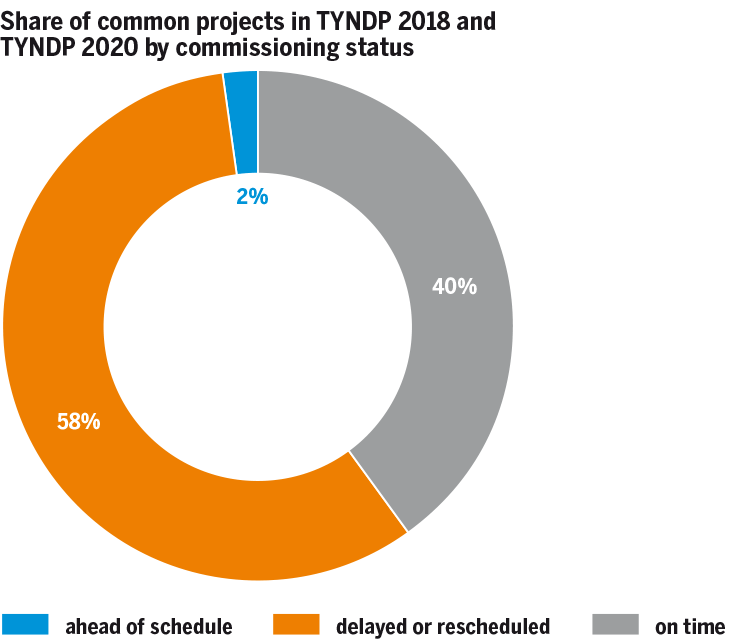
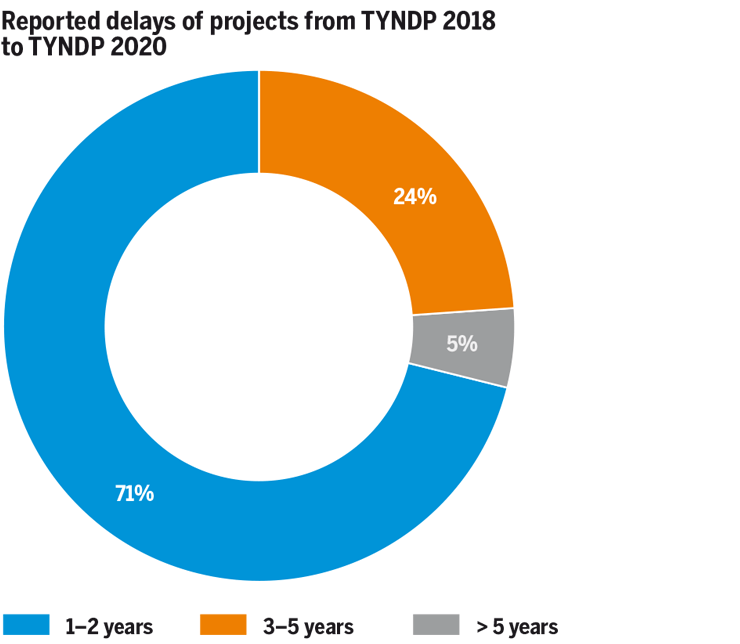
The following chart illustrates the status of those common projects according to TYNDP 2018 and TYNDP 2020 submissions. The charts show the share of those projects for which a delay has been reported regarding their expected commissioning date and the length of this delay.
Among the projects without delay (42 % in total), 3 have been submitted with an earlier commissioning date.
More than half of the submissions in TYNDP 2020 have reported experiencing delays since the last edition. Listed below are the main reasons for delays indicated by project promoters:
- Worsened and uncertain market conditions
- Delays in permitting/authorizations from competent authorities
- Lack of coordination between hosting countries/political uncertainties
- Delays in contract award procedure and/or procurement process
- Lack of funds/financing
- Interdependencies with other (delayed) projects;
- Delay following findings from concluded pre-feasibility study
5.5.1 TYNDP 2020 and Project of Common Interest Lists
According to Regulation (EU) 347/2013 Annex III.2 “[…] proposed gas infrastructure projects falling under the categories set out in Annex III.2 shall be part of the latest available 10-year network development plan for gas, developed by the ENTSO for Gas pursuant Article 8 of Regulation (EC) No 715/2009”.
Every TYNDP edition ENTSOG collects information also related to projects having already the PCI status and projects that intend to apply to the following PCI selection process. For TYNDP 2020 project collection, project promoters provided PCI information based on the latest approved PCI list at the time of the project collection (June, 2019) which was 3rd PCI List. The PCI process for the 4th PCI List was ongoing at the time. Subsequently, European Commission published the 4th PCI List on 31 October 2019 therefore ENTSOG updated the relevant project PCI information accordingly.
From the 106 submissions in TYNDP 2018 which had the 3rd PCI status, 82 were re-submitted for TYNDP 2020, while of the remaining of 14 submissions 2 were completed, 2 cancelled and 10 not resubmitted.
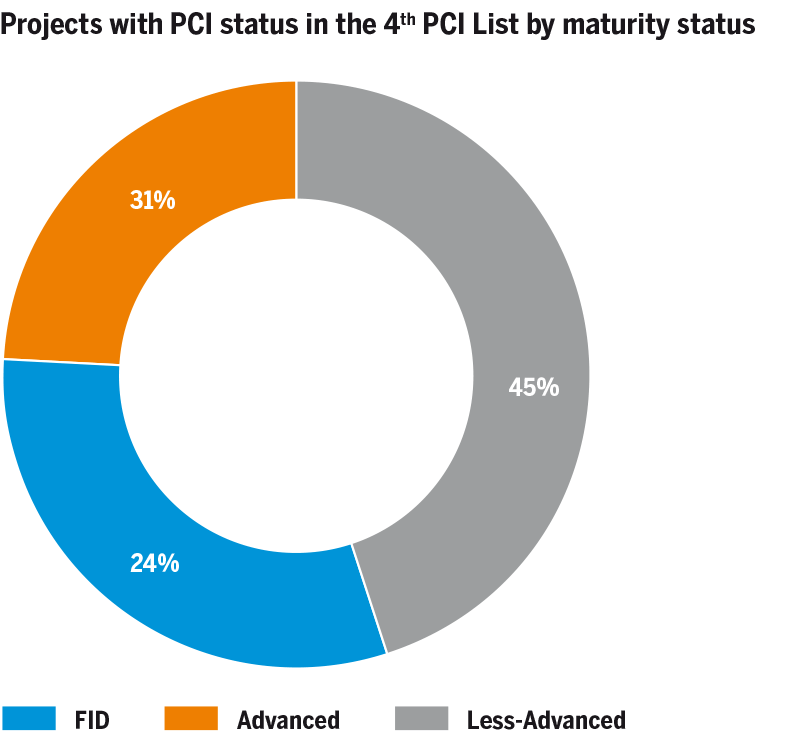
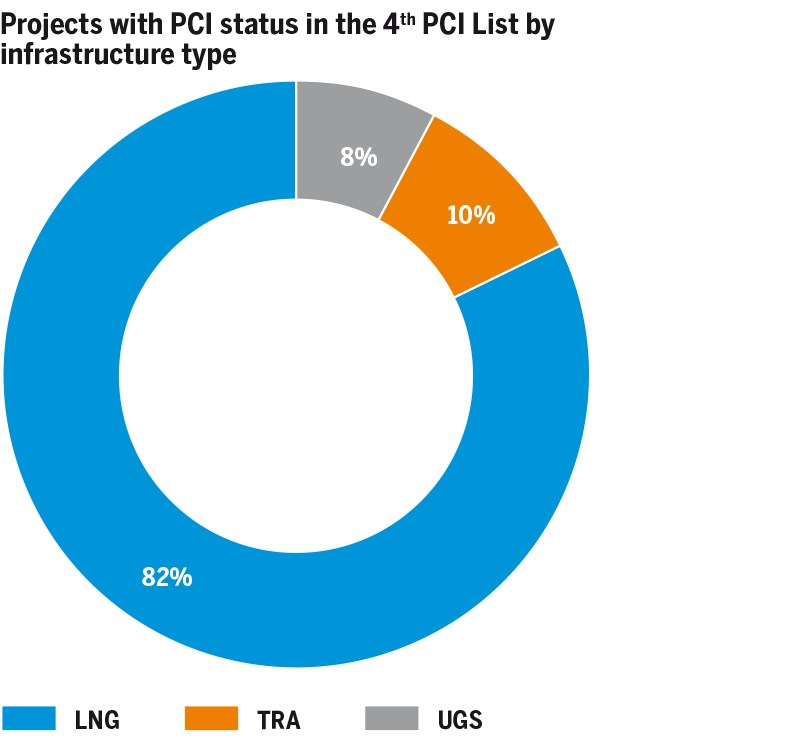
In TYNDP 2020 there are 62 submissions which are part of the 4th PCI List. Figure 31 and 32 show the split of these projects per maturity status and infrastructure type.
During the TYNDP project collection, promoters were asked to indicate whether they intend to apply to the next PCI selection process (i. e. the 5th PCI List). This information, collected from May to June 2019, represents only a declaration of intention and does not automatically translate into the application of the project to the next PCI round. The PCI selection is in fact a process completely separated from the TYNDP process and under the responsibility of the TEN-E Regional Groups led by the European Commission to which ENTSOG provides technical support.
In line with ENTSOG 2nd CBA Methodology, based on this declaration of intention ENTSOG has run a project-specific assessment on all these projects. The final list of the groups of projects on which ENTSOG has run a project-specific assessment was published on ENTSOG website17.
The results of the project-specific assessments are published with the final TYNDP publication in 2019 in the form of a project fiche.
5.6Investment costs
Investment costs are for project promoters in many cases commercially sensitive information and might have the potential to negatively affect the competitive position of project promoters vis-à-vis contractors.
However, as part of the transparency process adopted, ENTSOG has collected information from promoters on indicative investment costs for the submitted projects.
For the first time, cost information was provided by promoters for all submitted projects, further increasing the transparency of this Report.
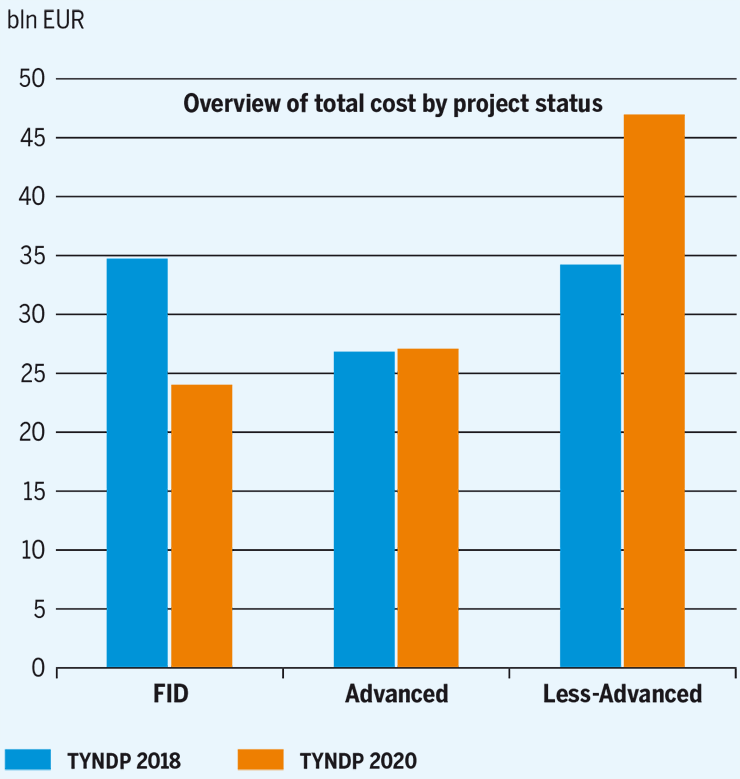
Figure 33 shows the total cost (CAPEX) per project status. The bar chart also offers a comparison between cost information published for TYNDP 2020 and TYNDP 2018.
Promoters submitted projects to TYNDP 2020 for a total of around 97 bn€.
According to available information, for FID and Advanced projects the total costs amount to approximately 50 bn €.
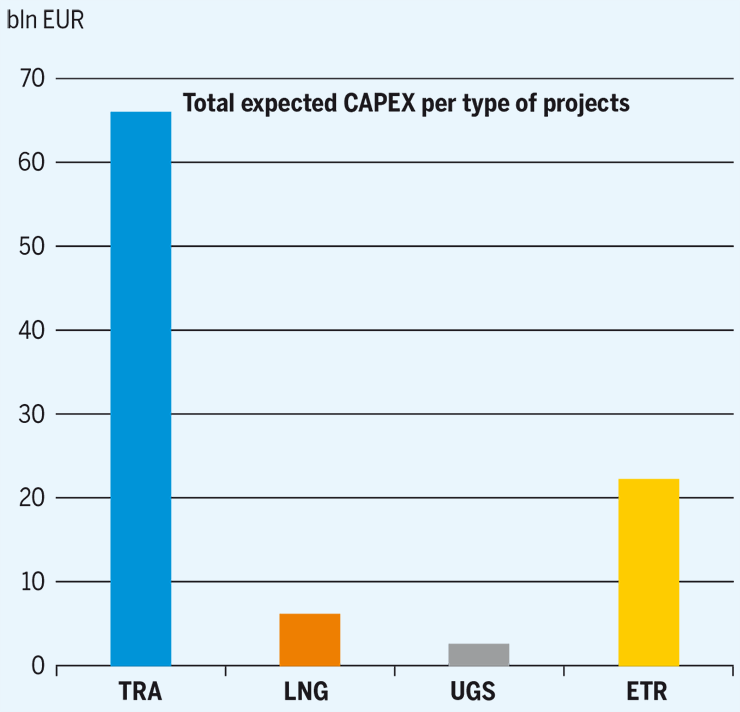
The distribution of the total expected CAPEX across different categories of projects is displayed in Figure 34.
Compared to TYNDP 2018 the total cost of submitted projects in TYNDP 2020 is about the same, in spite of 55 more projects included in TYNDP 2020 (considering also the 75 ETRs). This can be explained by the fact that:
- ETR projects represent 29 % of the total submissions and the average cost per ETR is about 70 % of the average cost of a transmission project;
- There are 17 less transmission projects in TYNDP 2020 compared to TYNDP 2018, while the number of UGS and LNG projects in the two TYNDPs is very similar, and
- The average cost per projects excluding ETRs is about 15 % higher in TYNDP 2018 compared to TYNDP 2020.
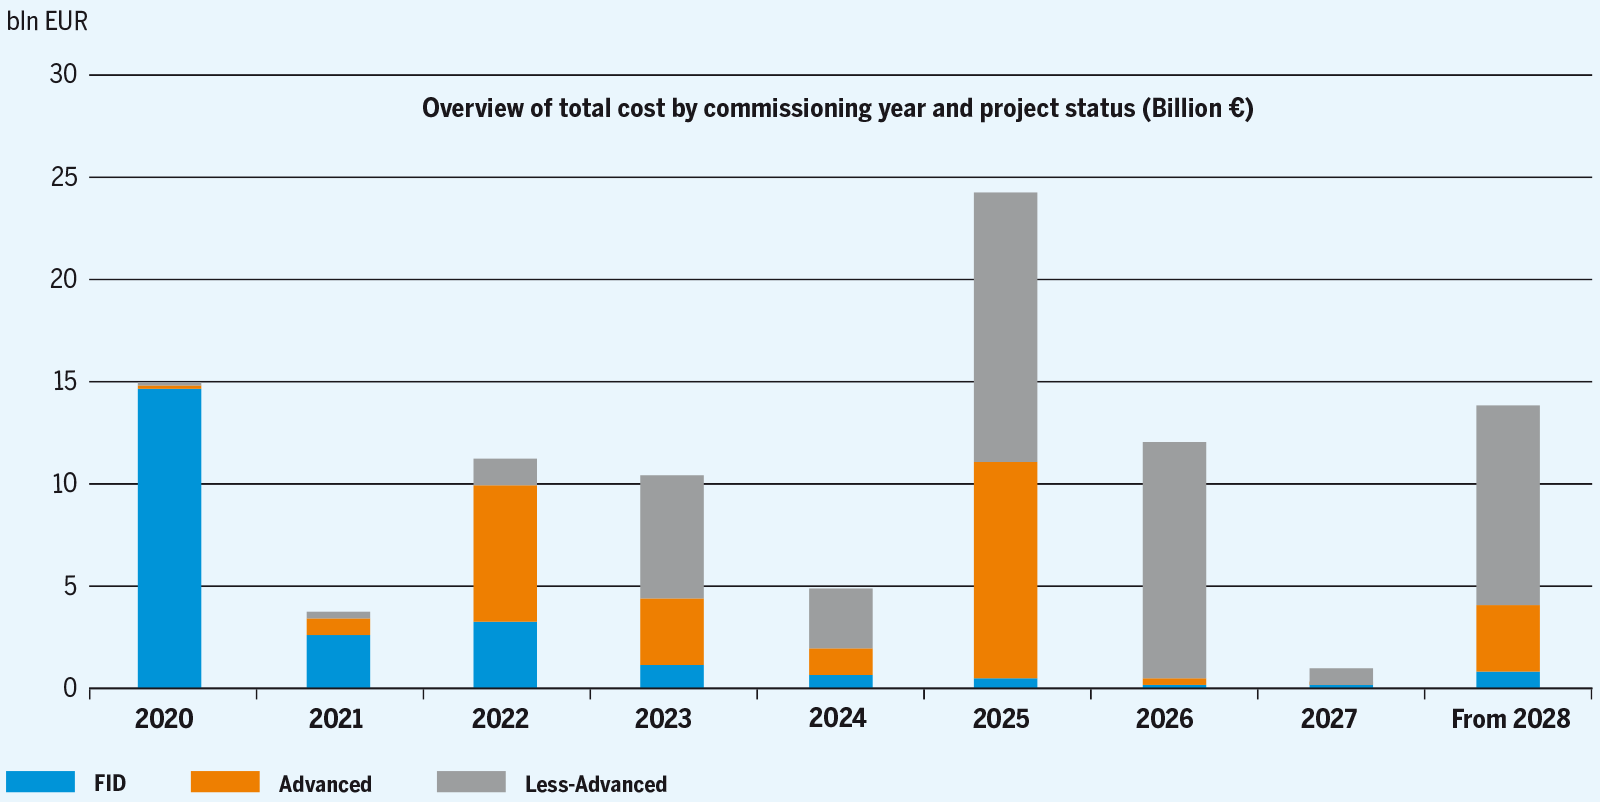
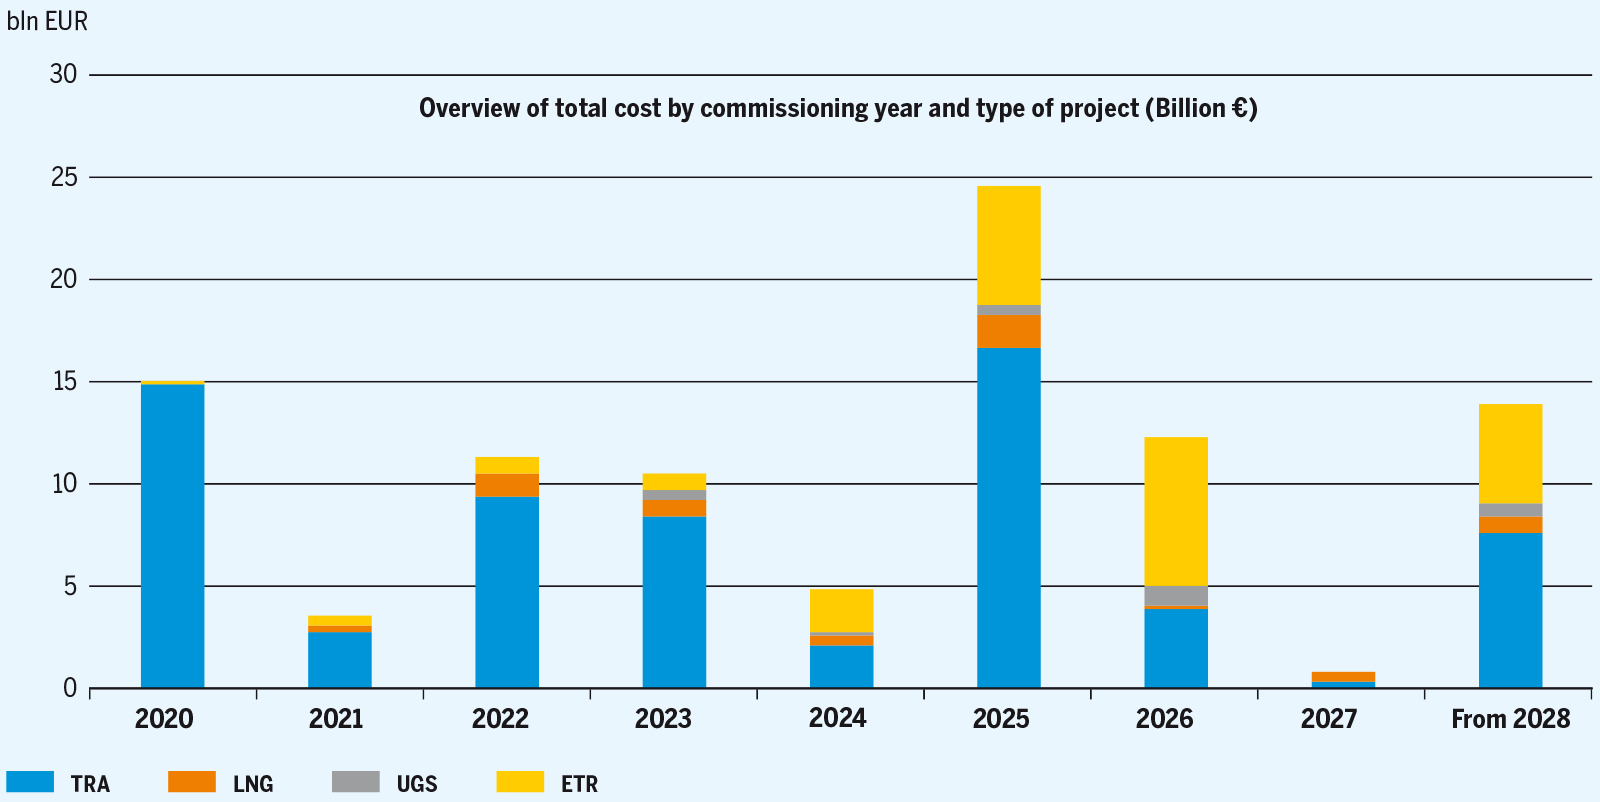
According to project promoters submission, investments are highly concentrated in 2020 – 2025 (with a peak in 2025 of almost 25 bn €), with around 72 % of the total expected cost to be experienced in those years. In this period 90 % of projects having FID or Advanced status are in fact expected to be implemented.
In line with the ENTSOG Practical Implementation Document, the cost data submitted by the project promoters for the projects to be included in the TYNDPs is made public by ENTSOG unless the data is deemed confidential by the respective project promoters.
While fully acknowledging the importance and the right of promoters to keep project cost information confidential, at the same time, it is important that projects for which promoters expressed interest in applying for the PCI label during the TYNDP 2020 project collection ensure the highest possible level of transparency and level-playing field.
On this basis, for projects whose promoters have indicated their intention to participate to the PCI process during the TYDNP 2020 project data collection and have marked their expected costs as confidential, alternative figures have been directly provided by the promoters based on reference costs. These figures, per project, will be used only for publicity reasons in order to ensure as much transparency as possible.
In the PS-CBA phase ENTSOG has considered only the project costs provided by the promoters during the project collection (and not the alternative ones), being each promoter the ultimate responsible of the submitted and most accurate data. In Annex A the origin of the costs published is clearly distinguished.
5.7TYNDP 2020 submissions and National Development Plans
According to Article 8 of Regulation (EC) No. 715/2009, the Community-wide network development plan shall build on national investment plans. This does not prevent, from a legal perspective, that projects are submitted to the TYNDP although they are not part of a national development plan (NDP), being the TYNDP a non-binding exercise.
Following ACER recommendation, project promoters have been requested18 to always indicate if their initiatives are part of the national development plan. If not, the project promoters had to indicate the reason for its project not being part of the National Development Plan.
18 For TYNDP 2020 edition, ENTSOG did not collect information on the inclusion in NDPs in case of ETR projects.
77 % of the TYNDP projects (excluding ETRs) are reported as listed in NDPs.
| Country | Part of NDP | NOT Part of NDP |
|---|---|---|
| AL | 1 | - |
| AT | 4 | - |
| AZ | - | 1 |
| BA | 3 | - |
| BE | 1 | - |
| BG | 6 | - |
| CY | - | 1 |
| CZ | 4 | - |
| DE | 16 | 5 |
| DK | - | 2 |
| EE | 4 | - |
| ES | 5 | 2 |
| FI | - | 1 |
| FR | 5 | - |
| GE | - | 1 |
| GR | 9 | 9 |
| HR | 14 | 1 |
| HU | 6 | - |
| Country | Part of NDP | NOT Part of NDP |
|---|---|---|
| IE | 2 | - |
| IT | 16 | 2 |
| LT | 3 | - |
| LV | - | 4 |
| MK | 1 | - |
| MT | 1 | - |
| NL | 5 | - |
| PL | 11 | 1 |
| PT | 2 | - |
| RO | 11 | 6 |
| SE | - | 1 |
| SI | 7 | - |
| SK | 5 | - |
| TM | - | 1 |
| TR | - | 1 |
| UA | - | 3 |
| UK | 2 | 1 |
Table 5: Overview of projects being part or not of NDPs by country (excluding ETRs)
For the projects reported as not part of any NDP, promoters have generally indicated one of the following reasons:
- The NDP was prepared at an earlier date and the project will be proposed for inclusion in the next NDP edition;
- No NDP exists in the country where the project will be built;
- The operators are not required to prepare and publish an NDP;
- There is no obligation at national level for such a project to be part of the NDP or the country is outside the European Union;
The above provided reasons show that, in most of the cases, a project is not part of any NDP for reasons lying outside the control of the project promoters himself. For further details, please refer to TYNDP 2020 Annex A.


